Displacement mapping challenge

my study area is the same
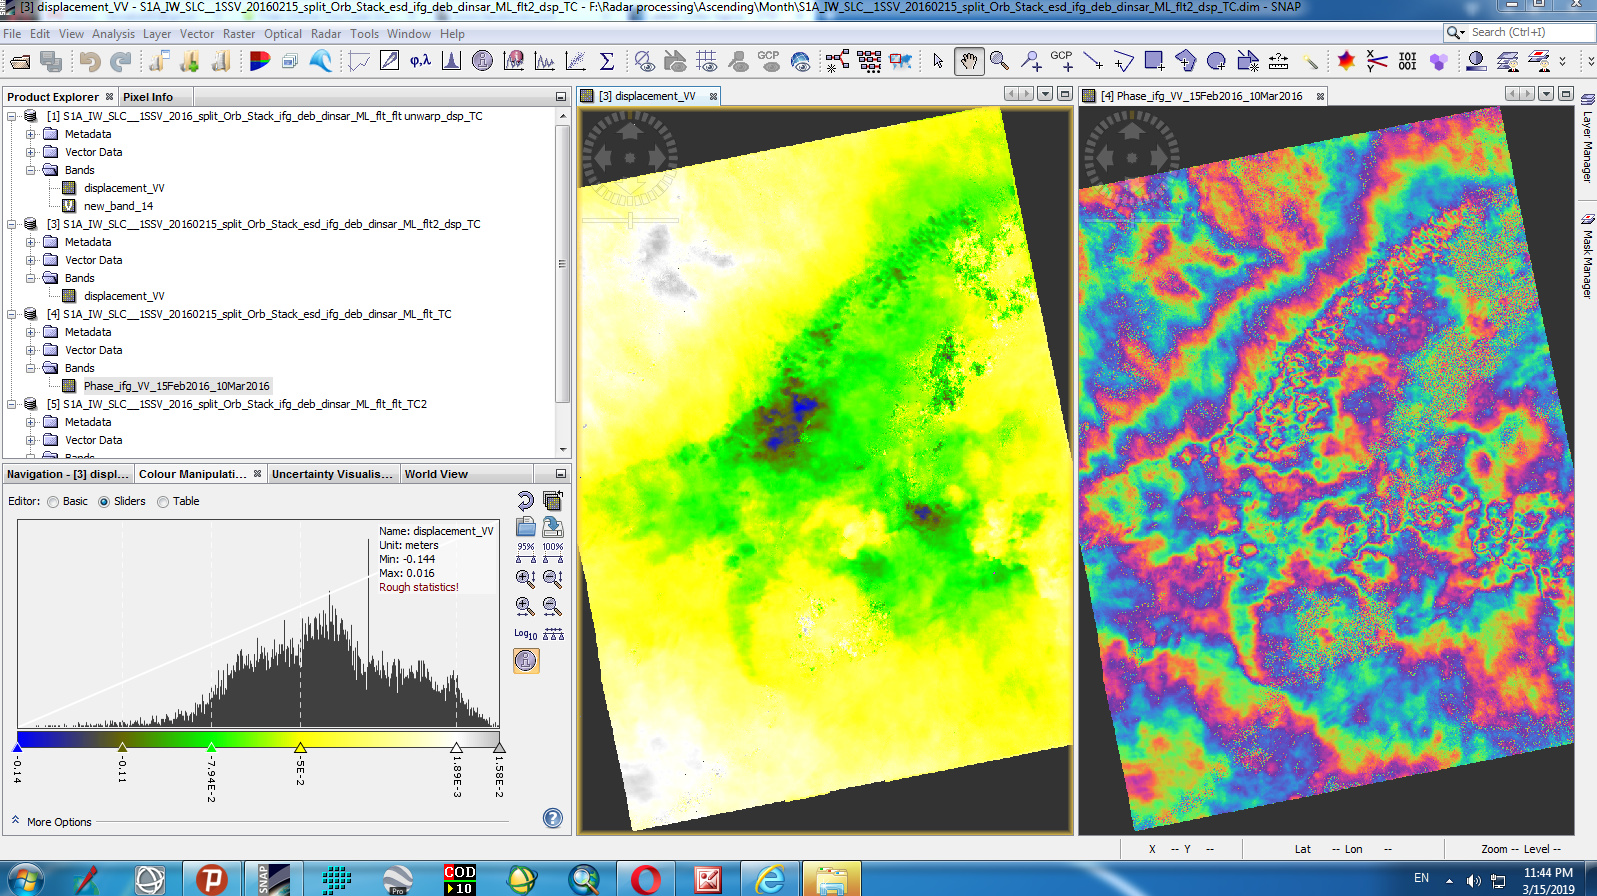
1.While I use one month interval. It seems like convening It has some correlation with the DInSAR fringe/,however the number i saw on the displacement map is highly exaggerate? why this?


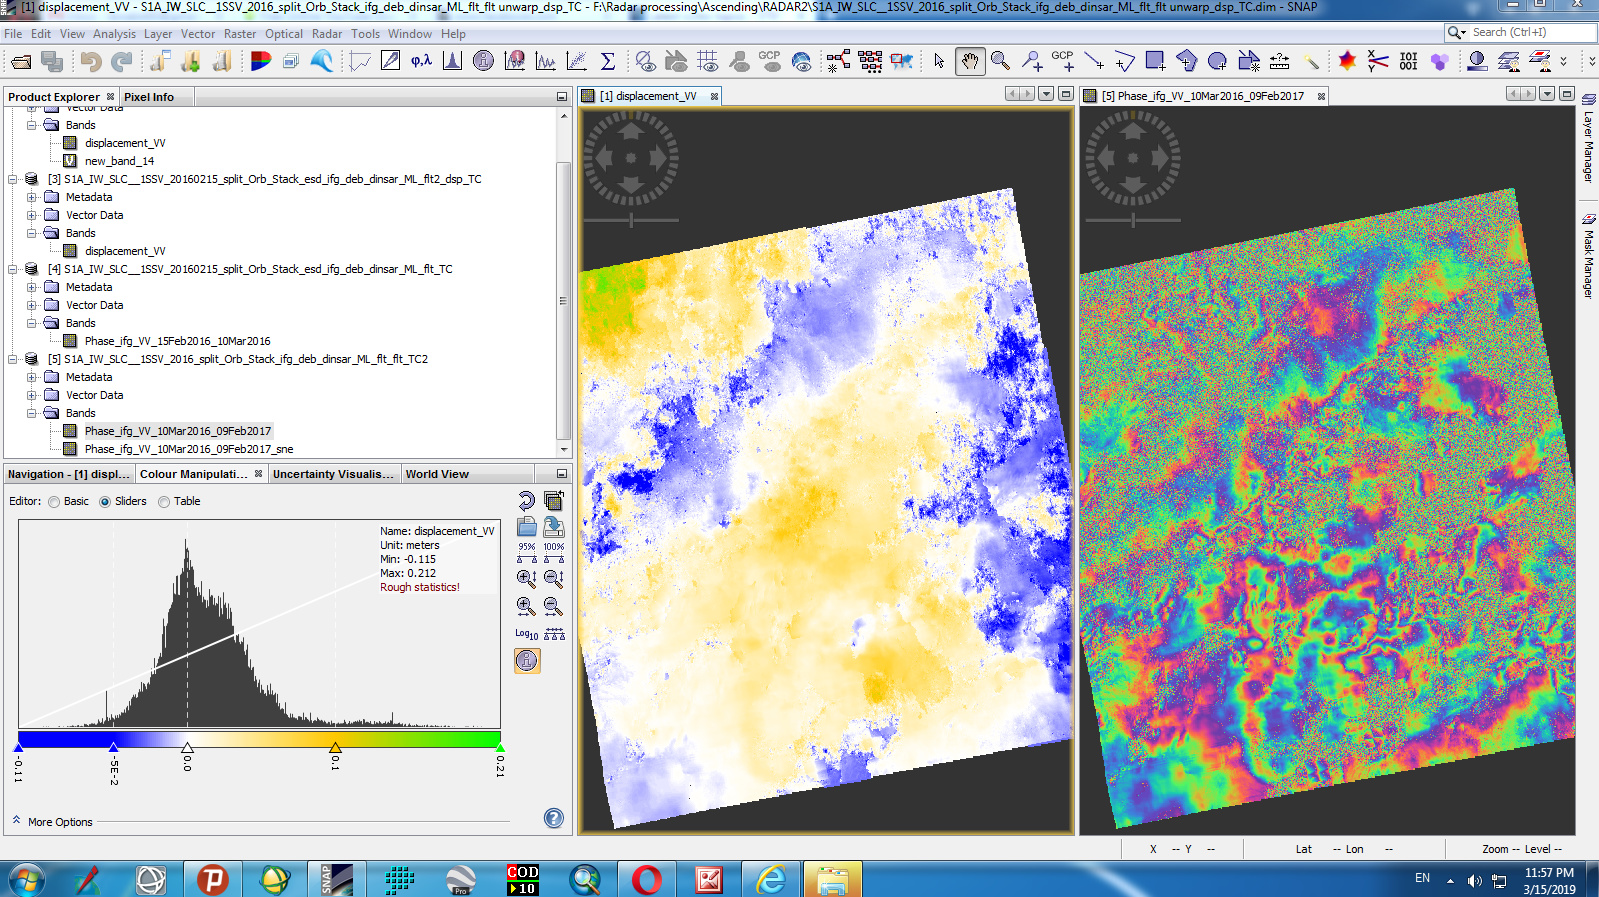
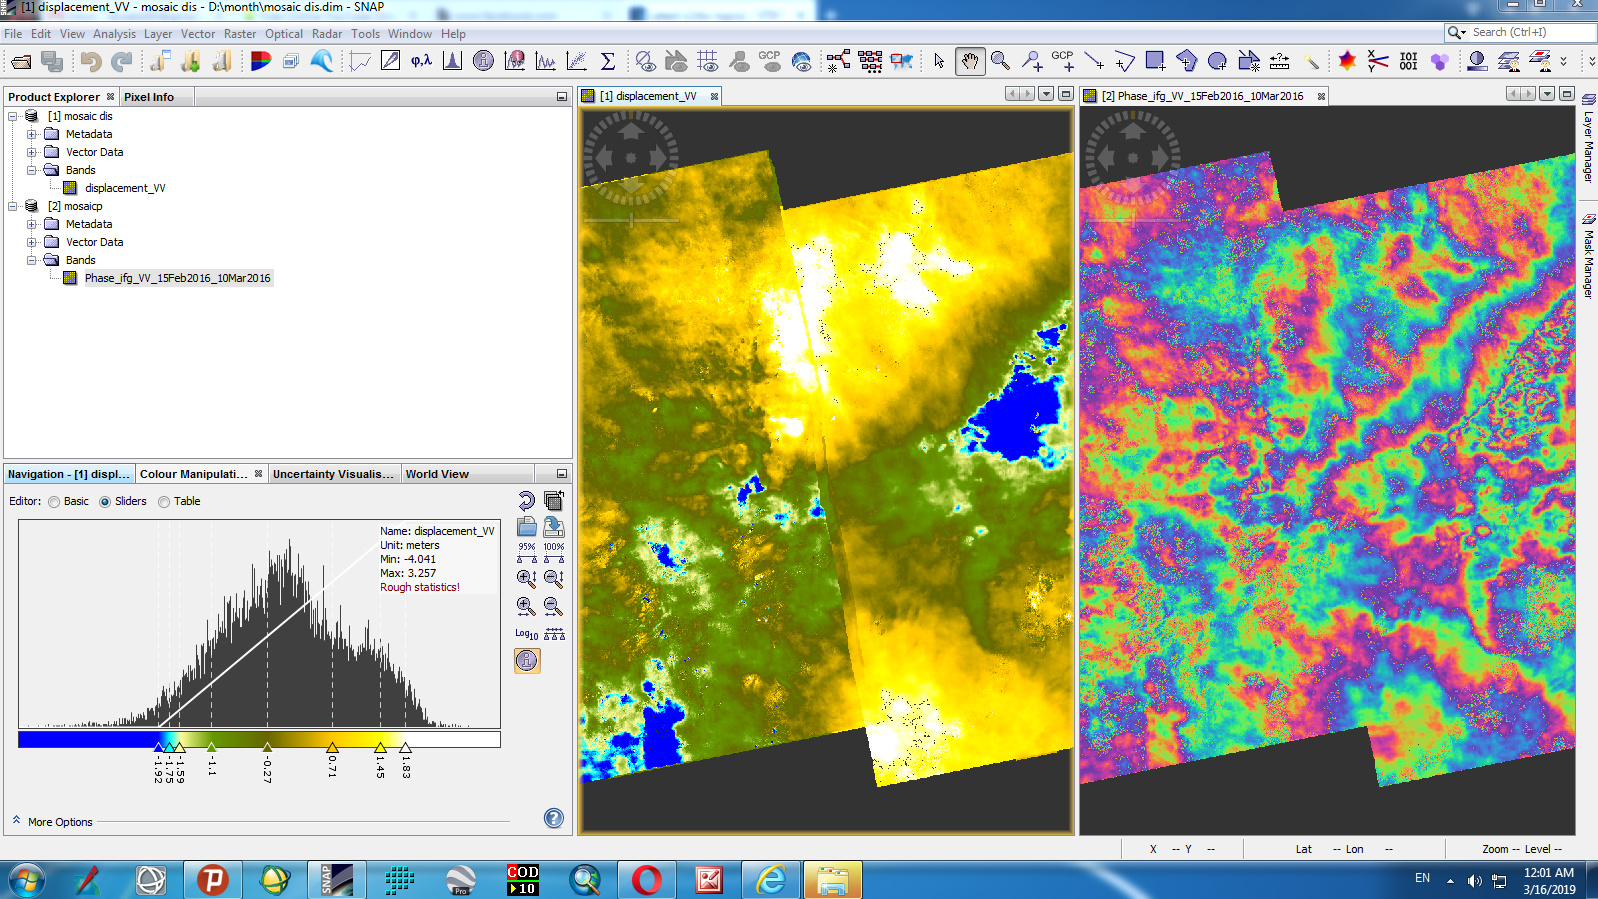
2. While i use one year interval. it seems like convencing on the interfrogram, but the displacement map i produce is completely wrong/it is out of logic/ ! i use band maths to modify it , but nothing changed? please give me your help?


3. While i do mosaicking ,it seems like perfect on the interferometer,but not on the displacement map?
why this how can i solve it?

It is my hope as i will get important answers to my challenge ,Thank you!

can you please show a picture of the topographic phase and the interferogram after topographic phase removal?

If the total deformation is too high according to your expertise in the study area, you can:

  • apply multi-looking (e.g. 30 m pixel size) before removing the topographic phase and unwrapping
  • apply strongr filtering of the phase
  • try SMOOTH as unwrapping method in snaphu instead of DEFO
  • use another image pair (descending) of a similar period to see if the pattern persists
1 Like

Thanks ABraun, Let me do all your recommendation and i will Show you
but , i apply multi-looking after topographic phase removal
when you say stronger filter you mean increase window size from 5-7 and a like

yes, anything that removes outliers more rigorously

ok ,thanks