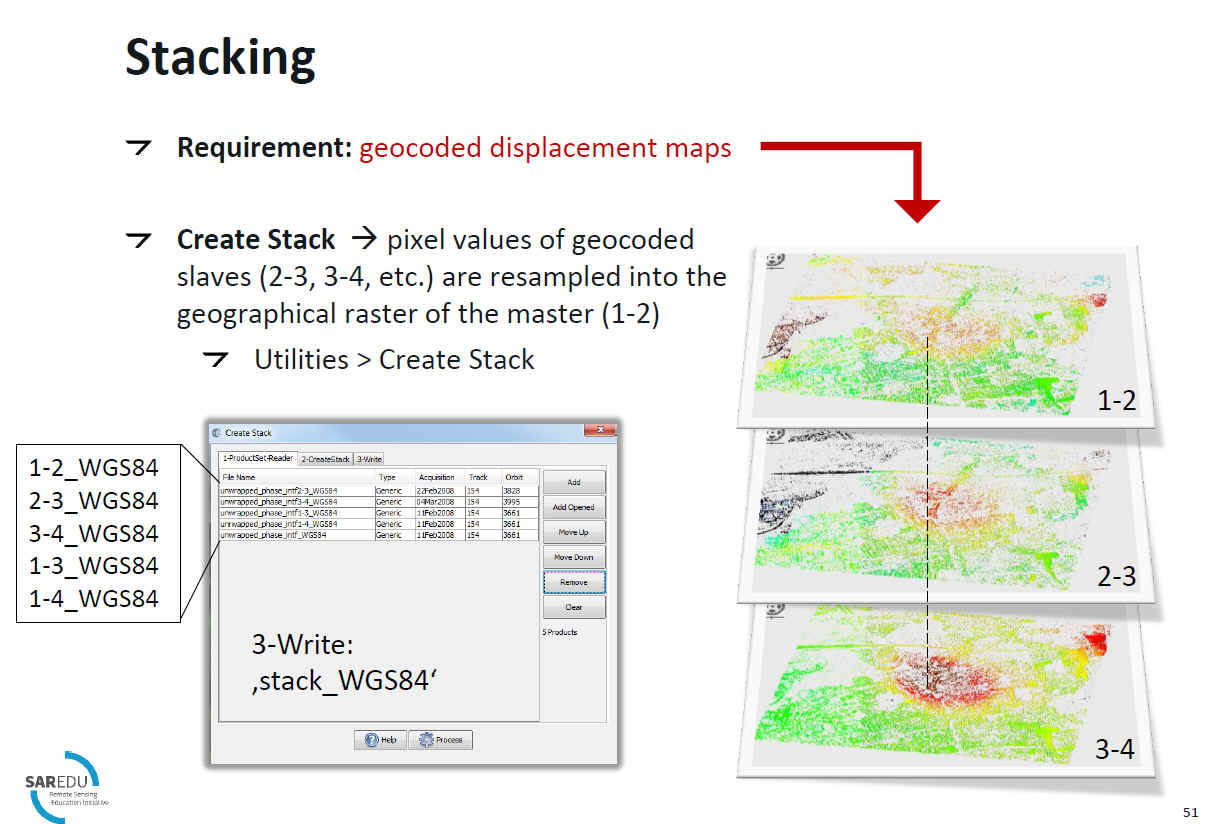
Hello, i would like to create an average ifgs (Interferogram Stacking) for subsidence mapping. i have some multiple masters-slaves ifg pairs (ab-bc-cd-…)
Can i just use SNAP to complete Step 7 to 10 in the Stack Averaging or i need to use Stamp/Matlab?
i have tried the averaging using snap but all of the phase are ruined. so, i guess…it is a NO
Later,
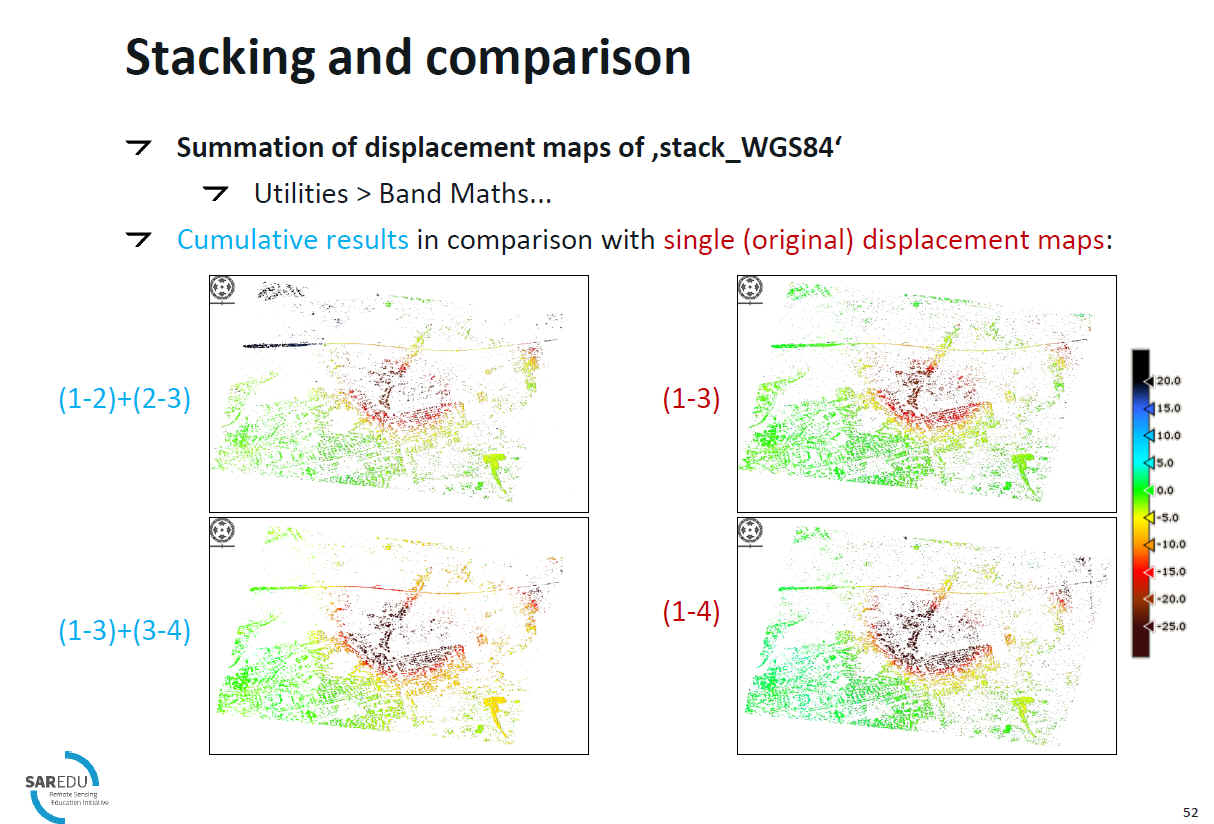
i have also come across a post on ID_3102_SAR-EDU_Tutorial_Deformation_monitoring_with_InSAR_pdf about the stacking for Summation of the stacks of Ifgs but no info how to Divide the Sum of Displacement by Total Time
the steps you propose refer to classic DInSAR, and you can do them without StaMPS/Matlab.
The question on how to summarize displacements referring to different periods is challenging, yes. Especially when all slaves refer to the same master, the results cannot be summed up becausee they refer to periods containing each other (AB is within AC, for example).
if we want to see the cumulative subsidence during (for example) a year, we should add all displacement bands for each pair using band math? (ab + bc + cd + de) is there another way?
@ABraun regarding the combination of interferometric pairs, what if the different pairs have different Bperp (even values that are considered to small for DEM generation). How does this affects the final average of unwrapped phases. Should these pairs be discarded?
Any update on this?
My approach of stacking a phase was to add all the angles together and instead of doing an average, I modulo PI. I think it is more correct at least it looks good and shows some fringe for deformations.
Really interested to know why this cannot go into Snaphu? It seems that this is a serious bottleneck at multiple levels.