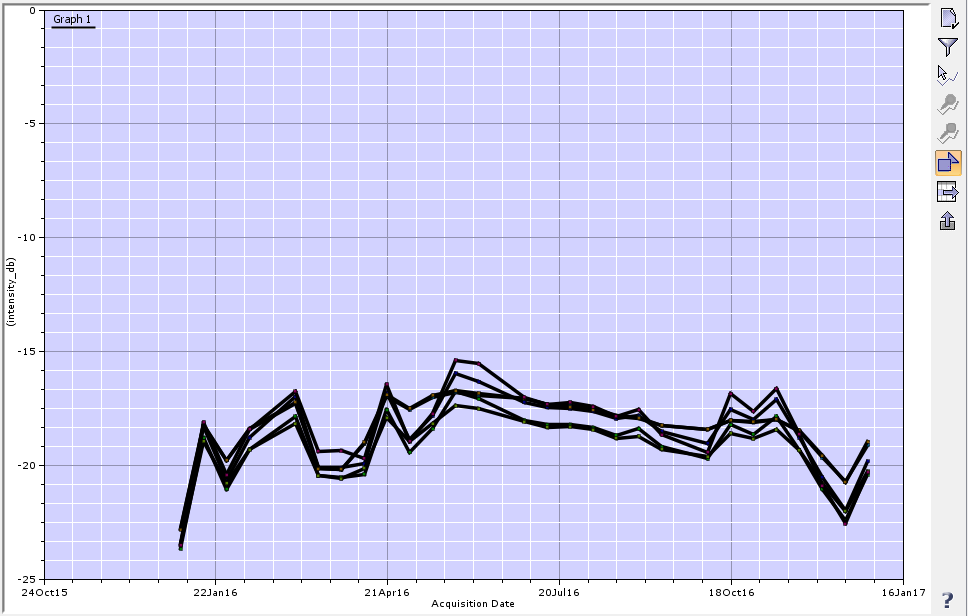
I have a problem with the Time Series tool ; I am trying to produce graph of coherence over time, with values extracted from polygone, so as to see how it changes for different objects over a year. I did it with backscatter images and it worked :
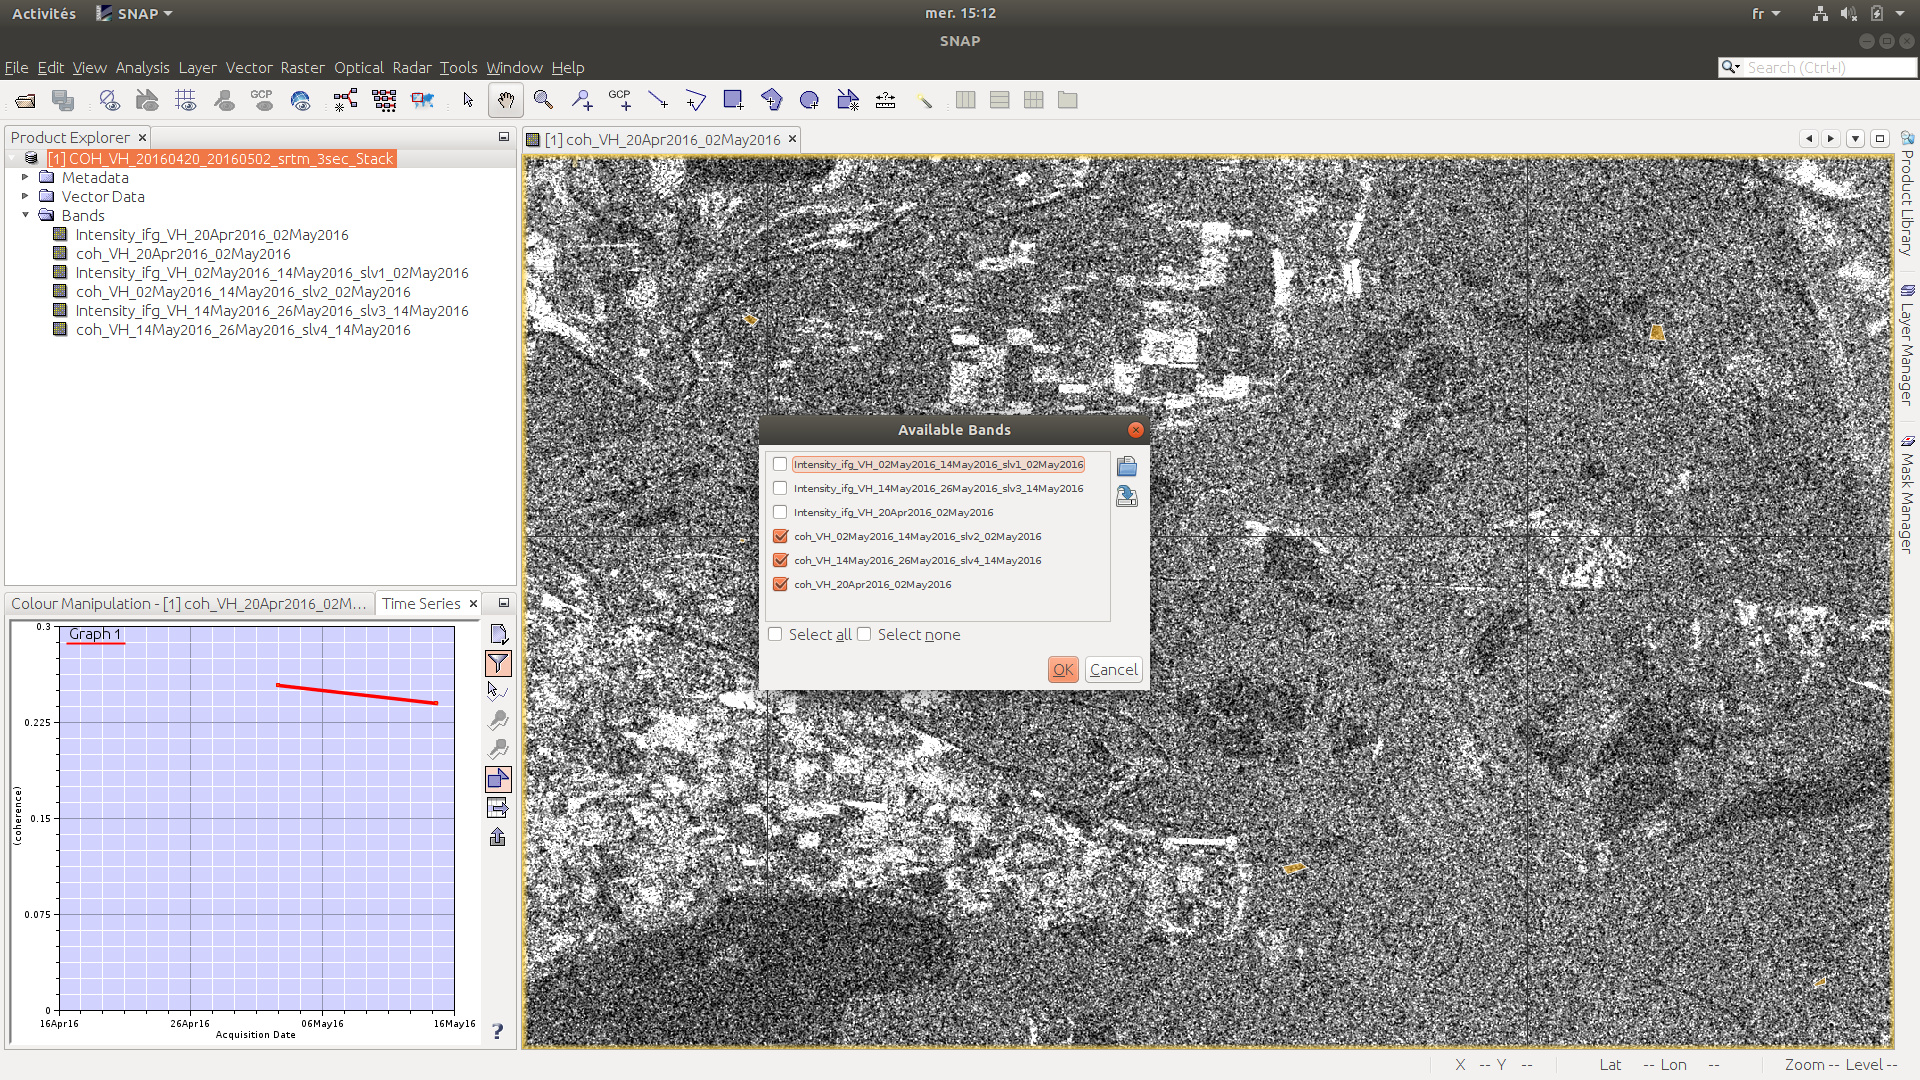
But when I try to do it with SLC coherence products, I obtain a graph that doesn’t seem to use all the images, or the acquisitions dates that I have. Here I use 3 different images but only two points appear on the graph :
I guess it is because coherence images are from two images with different day of acquisition ? Is there a way to use properly coherence images to produce graph where each of these is represented by one point ?
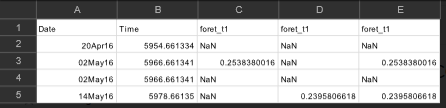
Also the text file that can be extracted from the graph gives this, if it can help :
I precise that I created a stack with my coherence images (from the .dim files), because nothing appeared on the graph just with all images opened separately on SNAP (although it worked for the GRD backscatter images).
I already looked into these topics, but I didn’t found an answer :
I finally found an solution to this problem after weeks of trying to find one and reading thread after thread and every tutorial with no real answer.
The solution for me was (i think) the right order of preprocessing AND (more important i think) a crucial step where you add a “new” band (with band math) to every (pair of 2) product called coh_VH or something, where you just copy the VH band thats in the product from the coherence estimation process.
You then have multiple stacks of 2 paired products with the same band names and the wierd band names from the coherence estimation (the wierd ones i remove in a following multilook process or TC but thats not needed).
If you now stack all these pairs into one big stack and load THAT into the time series you can choose ONE band (the coh_VH one) and it works just like it does with the backscatter.
Also doing both coh_VV and coh_VH in one single stack doesn’t work. I can only choose coh_vh in the time series, for some reason.