S1 interferometry using snap and python

hi all
I am new to SAR, I am not a real programmer and possess little ego so any comment of the below workflow or advice on how to handle SAR data in a better fashion is much obliged.
I have taken a project which aims to detect soil erosion in a seasonally flooding river bed in a semi-arid environment. I was planning to compute interferometry for some 65 images and image combinations - you can imagine how many image pairs that is…

i have been looking at similar issues posted in Graph Builder for InSAR processing but hope there is newer suggestions for this issu

So this note is to those who have experience doing this sort of workflow….
There are two key issued here:
The first is some basic general questions about sar data and handling and the second – problems related to the execution of the a wanted workflow. Ill start with the latter.
Workflow:
I was hoping to get a workflow using the snap graphs (which I have built, see below for details) but it’s not working, not in unix and not in windows environment. However taking individual steps in windows I was able to run the entire process with good results (in unix – it failed this too). Running this process on individual pairs step by step is not realistic so I thought maybe with the combo of python+snappy I’ll have better luck in stringing the whole process together. If anyone has a working code – I would love to test –modify for myself.
To save time I’ll just describe the process I want to execute (I can send the graph itself for your testing upon request) but for now I’d like to have some commens on how to build this in python snappy
The steps are
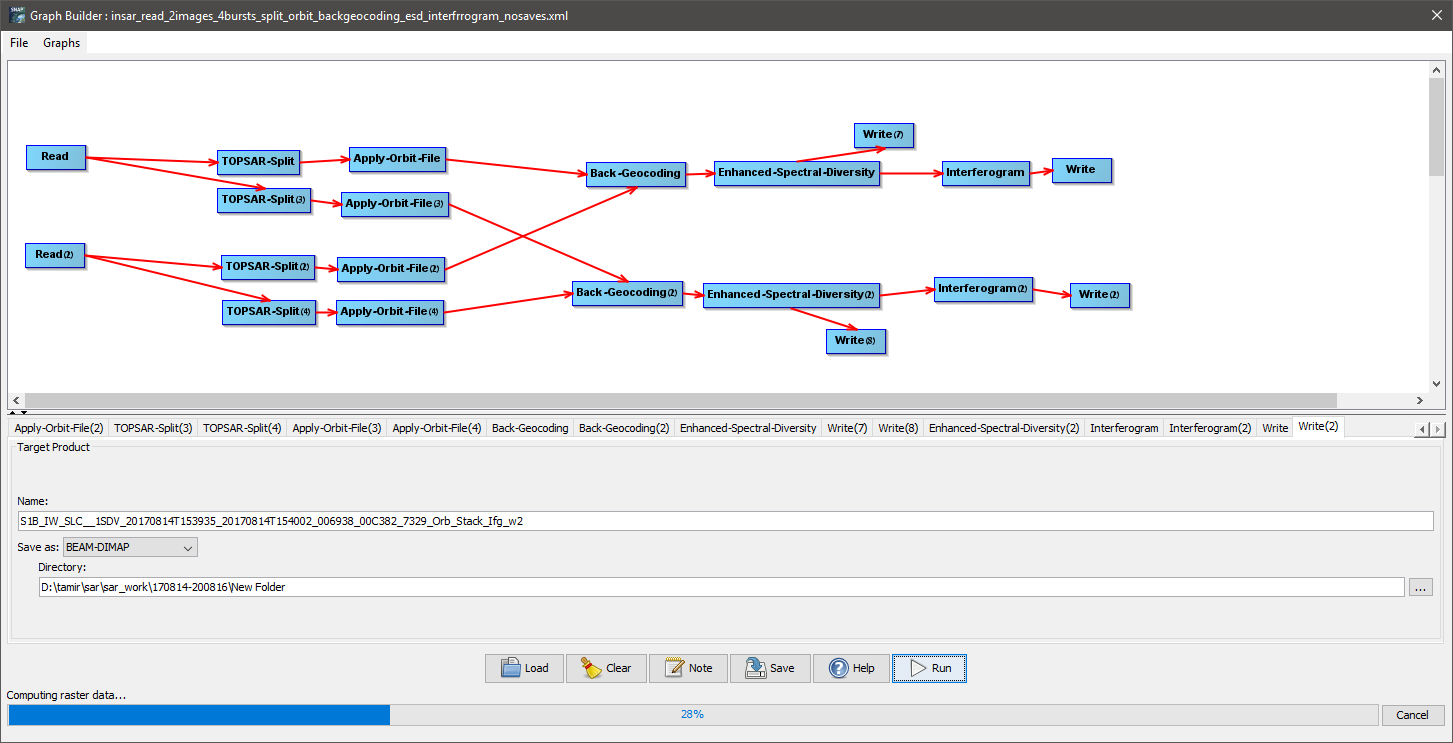
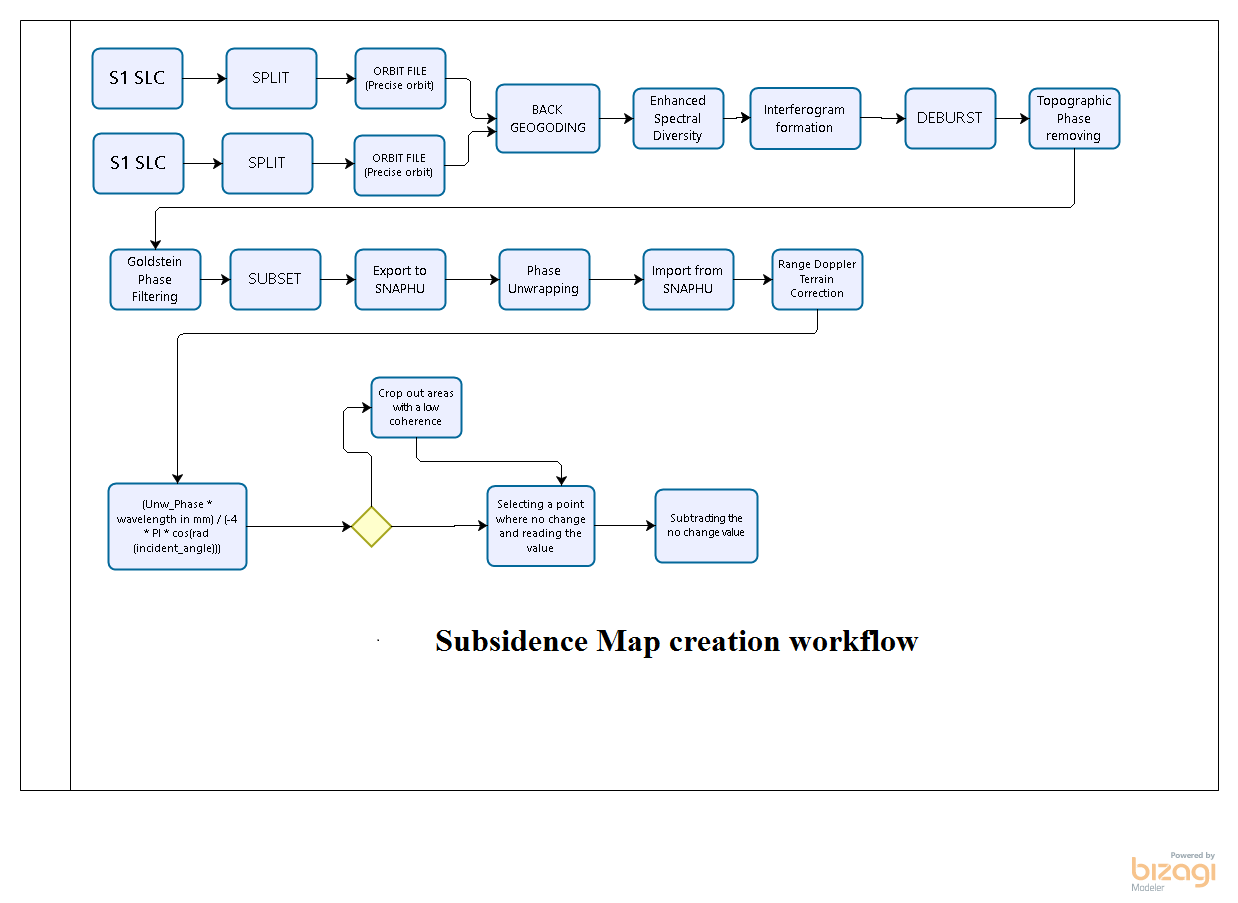
Read images (2img) >topsarsplit(2img)*>apply orbit file(2img) >>(and both into)>> back geocoding>enhanced spectral diversity filter (doesn’t work in a graph but does individually)>interferogram>topsar deburst>topo phase removal>goldstein phase filtring>write (ready for snaphu outside snap)

I made a bunch of scripts (graphs/models) in snap (v8) but it doesn’t work
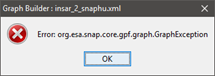
The first problem is I get the following error when I first try to open the graph for work

So
I tried to split it into sections and found that I can run the first 3 steps (topsarsplit(2img)>apply orbit file(2img) >>(and both into)>> back geocoding) but it gets stuck after that (the enhanced spectral diversity op. doesn’t work). I tried removing that step and I managed to run everything else…
Can anyone suggest why it doesn’t work etc etc ? Is this step necessary? are there any alternatives?

And to a more general question:
In the splitting op (topsar-split) I am asked to select the subswath (w1 /w2/w3) and the burst. My study site is spared on both w1 and w2 and on all 1-9 bursts for both swats. There is no option in the splitting step to include 2 swaths, is there? If I an use only one at a time (and go through each swath separately –that is I split the image into two - w1 and w2) - at what point can I merge them together into a single output?

Ill be very glad for some help and ill update here if and when I figure out solutions
But please if you have ideas for a completely different approach – one I didn’t think about – please suggest.

Many thanks in advance
Tamir

Thank you for the clear description of your issue - this helps us getting into the case.
I think the workflow is absolutely fine. But I don’t recommend using the graph tool because you lose control over the intermediate products. If an error happens in between, you will only find out in the end and troubleshooting is hard.

So my advise is to perform the steps one after the other and check how the result looks like.
What error message did you get? It is somehow missing in your post.

hi Abraun
firstly - many thanks.
your comment is absolutely right but - like i explained - i have hundreds of those to do - so doing it one by one or even step by step - is not sustainable. thats why im asking for help - if the graph maker system is not working on a complex job like this - maybe python is a better option.
so i have checked step by step and it works, and i have doe few groups of operations in one go and these are great too. the problem is creating a complete process so i can loop it through many images…

as for the errors:
image

and for the enhanced spectral diversity op i get a red writing in the graph gui saying something else but i cant find it again… but i have dreated a new graph and its now running the esd (apparently). it is very very slow (the computer has 128 g ram and its not moving). so maybe its not working…
ill update you if you wish.

btw - is there a way to increase snap’s memory allocation?

all the best
tamir

I’ll leave the topsar-split question for those with more SAR involvement (I do mostly ocean colour processing).

Before doing large scale processing with a graph of many steps, it is best to run a couple examples by hand in the GUI or using one-step graphs so you can check each step carefully

Unless you need operations that aren’t available in the graph processing facility (GPF), Python introduces new memory management complications, so is not likely to be useful.You can adjust performance parameters using Tools/Options/Performance in SNAP or, for GPT, by editing <SNAP_install_dir>/snap/bin/gpt.vmoptions. There are OS tools to display performance metrics like memory usage that can help identify bottlenecks.

I’m agree that at some point manual processing is no longer feasible, but it helps to understand where the error can come from.
Maybe it would be a start to split the graph into four parts to see where the error occurs.

  1. split, orbit, coregistration, ESD
  2. interferogram (including topographic phase removal) deburst, filter and subset
  3. snaphu export, unwrapping and import
  4. geocoding and conversion to displacement

This also helps to make the processing faster, because long graphs are not very effective.
I don’t have a solution for the differences between batch processing and GUI but if you have only one burst you have to skip the ESD operator.

I would not recommend using Snappy - it’s better and more performant to call gpt from a python script for your bulk processing. Very long graphs use a lot of memory and performance usually degrades. The split in four proposed by Andreas above seems like a good compromise to me.

1 Like

hi andreas and gnwiii

thanks for your reply. ill answer together because its related and also because the post subject has shifted a little…

firstly andreas - you are too late :slight_smile: i have done exactly as you suggested (great minds think alike). and to that end - i already followed both your advice and separated run all ops. everything work well and results are good (the errors i has were only when trying to graph them together).
so, i have done the 1st step as described in your suggestion (andreas). it works, no errors but its is incredibly slow (i mean hrs !!!). which directly relates to gnwiii’s comment.

why is the graph so sluggish? how is it different from running each step at the time? why running this is a python environment is less efficient?

how do i clean the memory between steps? i have seen a similar question pop up before in the forum and i don’t remember a solution (and i can’t seem to find it again). i think this is something that would speed up things as i believe the temp files accumulates in the ram/background…

gnwiii - your suggestion in editing the options for snap sounds like a basic and relevant option. i have endless (ok not endless but 128gigs ram should be plenty of resources) but i can see that less than 40% is actually used… in this case - where can i find more detailed instructions on how to edit vmoptions?

and lastly
i kind of liked the idea of running the entire workflow in python for few reasons -
first i thought it would be quicker than snap because memory allocation is better, the java environment is slower in general and maybe it allows to kill temp files inbetween ops. and also because it will allow working in linux environment (which currently is more buggy than windows).
additionally loops may be easier to set and will make it easier to include the snaphu procedure in the workflow…
with that in mind - i am so surprised that no one made this pretty basic and grassroot workflow into a blackbox tool where you list a bunch of inputs and get a stacked result in the end… i have seen one (https://zenodo.org/record/1322353) which looks like a good place to start… if i end up having something like that made - ill be happy to share…

oh it ended up a long mail with lots of questions. thank you loads for offering advice. see below the process im running right now for 3 hrs and got to 30%… i really need to fins a working solution…

many thanks again

tamir

SNAP is a Java software running on the Java Virtual Machine that in most cases is able to use most of the available CPU cores. Snappy is not up to the task and using it results in performance degradation. In the future we will provide Python-scripts for setting the necessary parameters for the gpt-calls. Some people have done this themselves as you point out, another example is the OpenSarToolkit:

A couple of comments about your graph and setup:

  • I would leave the interferogram generation step out, it a fast operation performed separately but it’s hard to predict how much it slows down your current graph.
  • Since you have lots of RAM I would recommend using part of it as a RAMDISK and copy the input products on it in the beginning of your script. There are some threads on this forum on how people have benefitted from ramdisks.

I think the responses have covered most of the options, but I want to add some perspective on multiprocessor systems. My HPC experience has been with NUMA systems (SGI and Intel designs). As you use more processors, the overhead from moving data between cores thru multi-level caches can be a bottleneck. There are examples where decreasing the number of cores resulted in higher thruput due to better utilization of caches and shorter data paths. Tuning an HPC process is a complex and labor-intensive task so is really only economic if you will be running the task 7x24 for years and have the help of experts who understand how to use the advanced instrumentation to measure cache behaviour, etc.

Most of my remote-sensing tasks have been I/O bound, so careful attention to data movements (different filesystems for input and output data, ramdisk for input or intermediate results) can make a big difference. Since this was a few years ago, few programs could use multiple CPU’s, so tuning consisted of watching for I/O bottlenecks and adjusting the number of processes for optimal thruput. I often found I could only use a fraction of the available CPU cores, particularly on recent Intel NUMA hardware which would throttle CPU’s to manage CPU core temperatures. I think those machines were designed for bursty workloads that don’t keep a CPU running flat out for long periods. I should mention GNU Parallel which is an easy way to manage jobs if your system doesn’t have one of the advanced job scheduling tools.

As for Python: a few years ago, Python proved very effective for speeding up tasks being done in Matlab, so got a reputation for performance. Today, Matlab, Python, and Java can (in the hands of the right people) give similar performance on many widely used tasks, so switching languages is no substitute for understanding the bottlenecks in your workflow.

1 Like

hi all
this can serve as an update and continue searching for a solution…

i want first to thank you guys for the previous advice. particularly the ramdisk advice. it works and all the below operations and their times are run in the 64gig ramdisk…

so firstly i discovered that in snap running a graph is an ineffective way to work.
for example - i want to run the following linear set of operations -
read image >esd (enhance spectral diversity) > iterferogram > deburst > write image
if i run the esd alone its about 1min (i mean - a graph with only read>esd>write)
if i run the interferogram alone its about 2min
and than if i run the deburst alone its about 1min
however, if i run the interferogram +deburst as one graph - 15min
if i run all three operations - 45min
i also tested what happens when i run one command while another is still running (so in parallel - is did it manually - and initially by mistake…) - similar times as running a graph with two op.

so i am beginning to think snap graph is starts by firstly initiating all operations in the graph, together, despite the fact they are linear/progressive (ie the input of the second op is the output of the one before it)… as results the graph works super slow and at 5-6 consecutive operations its exponentially slower… wither im right or wrong - graph seems to do the opposite of what its supposed to, instead of automating operations execution to make things easier and quicker and using less memory, less reading and writing etc etc - it is a ‘stick in the wheel’ in terms of building a sequence of operations and rectifying this behavior this should be prioritized by snap developers…

ok once i figured this out

anyway so i thought - get all ops laid up in python and let python run them one by one. (at this point i wonder if one should consider running the same graph in some java environment ide and would it work?). i am not an experienced python programmer so realistically i could use javascript

python
after having hell trying to make python open snappy (marpet wrote somewhere to use 3.4 python but i tried, failed and successfully tried 3.6 because i cant get numpy on 3.4 plus i saw ppl are using it and it works). anyway following this i have a bunch of questions (i scanned other forums threads - nothing like my problems… :slight_smile:

firstly - if i ‘import snappy’ - i got some weird package that has this name. took me some time to work that out, kill the snappy and reinstall snap for python based on marpet (https://senbox.atlassian.net/wiki/spaces/SNAP/pages/50855941/Configure+Python+to+use+the+SNAP-Python+snappy+interface) guide (thanks marpet).

now i have snappy running within python, i have gone through few of the examples in the above link - works. i used pycharm (which i don’t really like) becouse it allows to set different environments. in the past (on my lynux computer) i use spyder (i prefer) but the python installed there is not 3.6 (i think its what was installed with qgis)

however
i am so far failing to find commands (or failing to write the correct syntax) for sar interfetory processes. there are fair few examples of how to run commands (similar names to the graphs ops) those i have tried seem to work.

i would appreciate a couple of examples (eg - how to run interferometry or TOPSAR split).

1: first i don’t seem to understand where the radar related toolbox is…

2: what to import - i thought “from snappy import GPF” should have done it but within that - i can’t seem to work out the syntax for specific radar operations - topsar split or deburst for example. i would love a couple of examples like there are in (https://senbox.atlassian.net/wiki/spaces/SNAP/pages/19300362/How+to+use+the+SNAP+API+from+Python)…

3: id there a command that will let me import a sentinel 1 zip product directly into the python environment?

i found a list of apparent commands in a site and i can see ‘topsar split’ exists but i couldn’t find how to get it to work within a command…
i am expecting something like

from snappy import GPF

from snappy import ProductIO ``

# 1. Imports

p = ProductIO.readProduct( 'some sar image.dim' ) # read product

# 2. Fill parameter GPF

parameters = topsarsplit()

parameters.put( 'whatever parameter 1' , 'XXX' )

parameters.put( 'whatever parameter 2, 'YYY' )

# 3. Call Operator

operator_name = 'topsarsplit'

target_product = GPF.createProduct(operator_name, parameters, p)

so if i get it right - i can string all other 18 operations like that and it will overall work and i can later imbed this code within loop and - done/

hoping for an alternative approach -

another question (and again - i looked in some of the forums but i didn’t see relevant examples) i would like the same type of script as above but this time - to run an xml graph i already prepared in graph builder… i saw

(https://zenodo.org/record/1322353)

seems to do this exactly but i couldn’t work out from their code how they call and execute these xml graps

that is it for now.

i am still seeking help so if you can point me to the right direction - it will be very helpful.

when i have a working code ill be more than happy for help sharing it on the code example list.

tamir

1 Like

As a general comment, linux provides many tools to help understand performance problems. Just relying on “clock” time doesn’t tell you where the bottlenecks are. At a minimum you need to be able to see how many CPU’s are being used and how much of the time your process is waiting for I/O. For some systems, you need to watch for CPU temperatures that trigger reductions clock speeds. I like bpytop:

$ python3 -m pip install --user bpytop
[...]
$ ~/.local/bin/bpytop

Your ramdisk can be very helpful, but you need to avoid reading and writing to the same storage device. Some processes use temporary storage which in linux may go to $TMPDIR or some other configurable location. Use the iotop command to help search for bottlenecks.

Hunting the Performance Wumpus is a useful introduction, but doesn’t address some of the issues with modern NUMA hardware.

hi gnwiii
maybe ii didnt make that clear - all the times above - windows 10…
the snap on linux is more buggy by far…

Linux dominates high-performance computing (HPC) so has many freely available tools to help identify the reasons for performance problems. We really need more information to understand why the 3 operation graph is so much slower – Windows may not make it easy for you collect the required information.

I wouldn’t agree that SNAP on linux is more buggy, but I would agree that many users have more problems with linux than with Windows.

hi gnwiii
sorry last night i was in a bit of a rush
the times above are from a pc run computer (win 10, with ramdisk etc etc).

i tried to make the separate ops work in linux (on my laptop) but it wouldn’t run them even separately… so in the end oi thought - not worth fighting this. i kind of hope that once i manage having thje process in python - i can run it on any machine (we are about to install dual boot on the above workstation). if you have a recommendation of what distro work best with snap - pls let me know.

however at the moment the issue is getting the snap-python code ready and for that i need the examples as my previous communication. i hope that someone like marpet or andreas can direct me to the right syntax and ill do the rest.
or maybe someone will suggest an alternative strategy all together…

Python will always be slower currently - it won’t even use all of the cores. If it’s performance you want, forget snappy.

Also, gpt-graphs are not sequential operations where a “raster” is passed to the following step until the write-operation. In fact the write-operator “pulls” data in tiles from the reader through the pipeline set up by the graph.

hi folks
so fare im getting more and more confused and im no closer to understand whet to do.

so pls look at the graph in the initial mail.
what would be the best way to run this operation if i wanted to loop it on a large bunch of pairs (>30)

and please if you can direct me to a link with examples that show how to do it - would be even better

Hi mate,

I would suggest you to call gpt in a python run command.

First this function is nice to optimize your snap configuration:

def get_gpt_cli(graph_path: str, other_args: list, display: bool = False) -> list:
“”"

Get GPT command line with system OK optimizations.
To see options, type this command line with --diag (but it won't run the graph)
Args:
    graph_path (str): Graph path
    other_args (list): Other args as a list such as `['-Pfile="in_file.zip", '-Pout="out_file.dim"']`
    display (bool): Display CLI and SNAP options via --diag
Returns:
    list: GPT command line as a list
"""
gpt_cli = ['gpt',
           graph_path,
           '-q', MAX_CORES,  # Maximum parallelism
           '-J-Xms2G -J-Xmx{}'.format(bytes2snap(MAX_MEM)),  # Initially/max allocated memory
           '-J-Dsnap.log.level=WARNING',
           '-J-Dsnap.jai.defaultTileSize={}'.format(TILE_SIZE),  # Tile size, set to 4096
           '-J-Dsnap.dataio.reader.tileWidth={}'.format(TILE_SIZE),
           '-J-Dsnap.dataio.reader.tileHeigh={}'.format(TILE_SIZE),
           '-J-Dsnap.jai.prefetchTiles=true',
           '-c {}'.format(bytes2snap(0.75 * MAX_MEM)),  # Tile cache, up to 75% of max memory
           # '-x', # Clears the internal tile cache after writing a complete row to the target file
           *other_args] 
if display:
    LOGGER.info(gpt_cli)
    sys_utils.run_command(gpt_cli + ["--diag"])
return gpt_cli

Then for exemple my Snaphu Export function:

def snuExport(Dinsar_beamdimap, statCostMode=“DEFO”, initMethod=“MCF”, outdir=“Default_Path”,
snu_export_xml=r"D:\Radar\SNAP_graph\snuExport.xml"):
‘’’

Export result of insar SNAP chain, BEAM_DIMAP format. provide configurations for "Snapu-unwrapping".
https://web.stanford.edu/group/radar/softwareandlinks/sw/snaphu/snaphu_man1.html

:param Dinsar_beamdimap: the interferogram you want to export BEAM-DIMAP format
:param statCostMode: "TOPO", "DEFO", "SMOOTH", "NOSTATSCOST"
:param initMethod: "MST" or "MCF"
:param snu_export_xml: reading snap graph.xml
:param outdir: default is "snu" folder at the insar image's root
:return: export directory
'''

# create outdir if not specified
if outdir == "Default_Path":
    workDir = os.path.dirname(Dinsar_beamdimap)
    outdir = os.path.join(workDir, 'snu')

# create output folder if not existing
if not os.path.isdir(outdir):
    os.makedirs(outdir)

properties = ['-PwrappedFile={}'.format(Dinsar_beamdimap),
              '-PexportTarget={}'.format(outdir),
              '-PnbProc={}'.format(MAX_CORES),
              '-Pmode={}'.format(statCostMode),
              '-Pmethod={}'.format(initMethod)]
cmd = get_gpt_cli(snu_export_xml, properties)
# print(cmd)
print('')
print('---------Exporting: {} - Mode: {} - Method: {} ------------'.format(os.path.basename(Dinsar_beamdimap),
                                                                           statCostMode, initMethod))
tic = perf_counter()
sys_utils.run_command(cmd)
toc = perf_counter()

print("Elapsed time: {} sec ".format(toc - tic))
print("------")
print('')

exportDir = os.path.join(outdir, os.path.basename(Dinsar_beamdimap[:-4]))
return exportDir

I’m not an expert, this solution is surely improvable, but it works great.
Hope it helps, i’m also struggling a lot finding informations here and there :slight_smile:

Ari

2 Likes

You have propobly solve your problem already, but as I used the advice given here, I thought that I would write my solution, because I was struggling with a similar problem.
I wrote a python loop that will carry out all the steps you mentioned and create new interferograms. The loop used (of course) snappy tools.
However, it only produced the first interferogram, and did not go beyond the completion of the first step, nor did it close it. The process continued after the first file had finished and no error was displayed, but the loop didn’t go any further.

Ultimately, after trying many different solutions and searching the internet, I found that the most optimal solution was to use the SNAP command line. I used Python to write and loopout consecutive command lines for every interferogram which I then pasted at once into the SNAP command line. SNAP takes one commend line, processes the xml graph and then goes to the second posted commend line. So when I posted 25 of them, it processed every one, one by one. And the SNAP commend line worked much much faster then Python enviroment.

2 Likes

By “SNAP command line”, do you mean SNAP’s gpt? The snapista python library allows you to build a graph using Python (ESA SNAP snappy is only used for the details of gpt operators) and then run SNAP’s gpt. I addition to the docker contained, the teradue conda repository provides a linux package that includes SNAP.

1 Like

Thanks! Good to know!