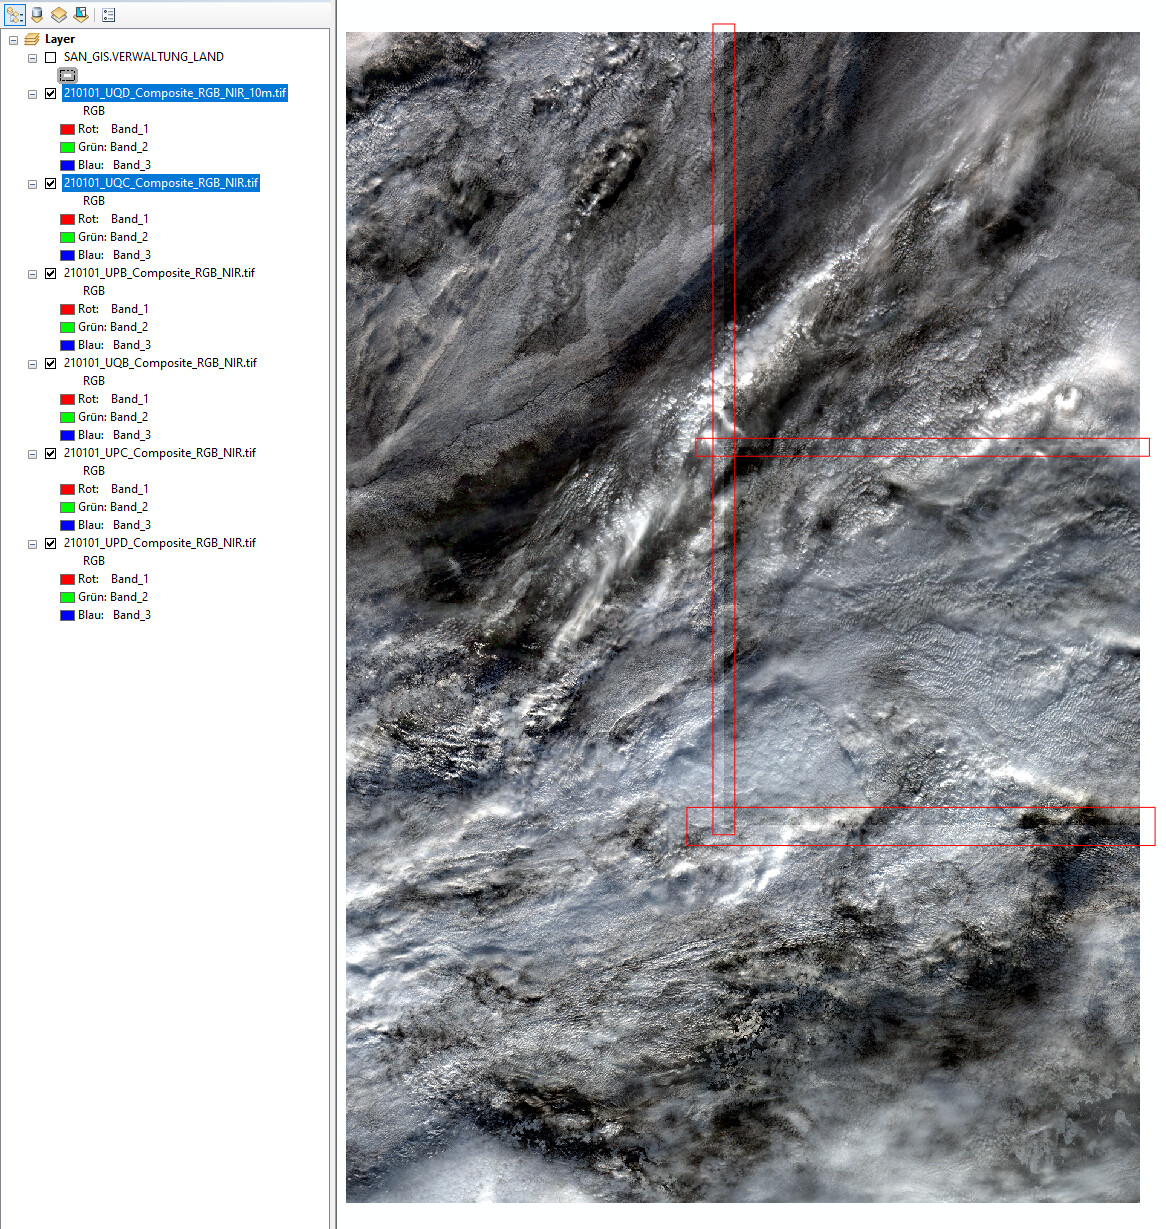
I am new to remote sensing data and for this purpose I downloaded Sentinel-2A data for adjacent tiles. In the long term I want to moasaik the data and i already know how to do it with the multi-size tool in SNAP. However, although the images were generated at the same time by sentinel (21.01.2021, cros checked with the available orbit footprint) the two images (32UQD and 32UQC) differ in the overall reflectance (sharp line) between the adjacent tiles (see below).
thaks for the fast reply. I Just finished the mosaic in snap for the most upper adjacent tiles. I just took the raw Sentinel-2A data. Do i need to do anything to the data prior to mosaicing?
How can I check for contrast streching? And if it is a matter of contrast why are all the remaining tiles, 3 on the left and one below the two grayish one, correct?
with contrast stretching I meant that ArcMap might assign different min/max values when displaying the individual (non-mosaiced) tiles. Please have a look here if this is the case:
If you are using L2A products, there is not much you can do about the lines after mosaicing, because they are already calibrated to bottom of atmosphere. Some discussions on this issue are here: