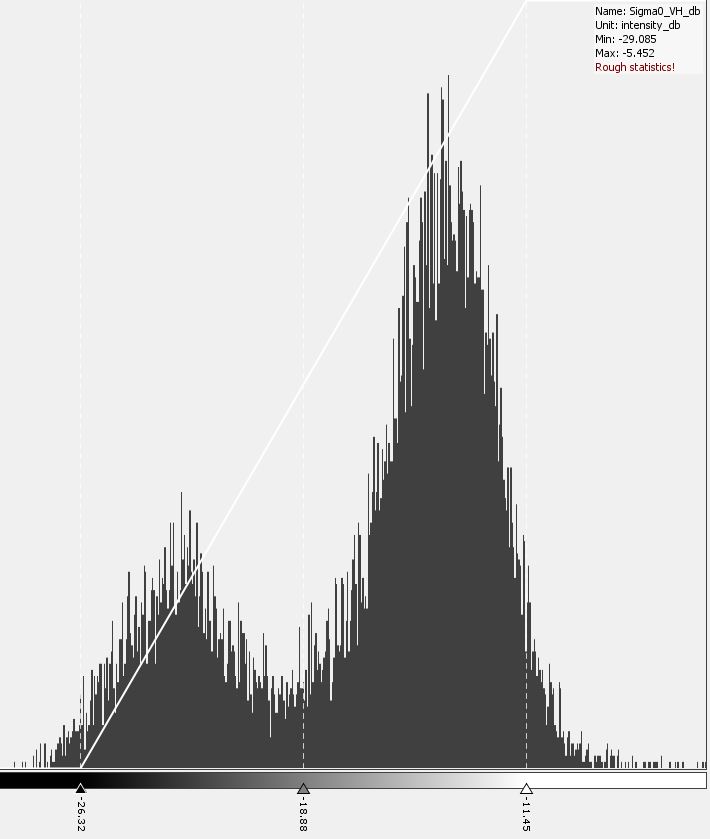
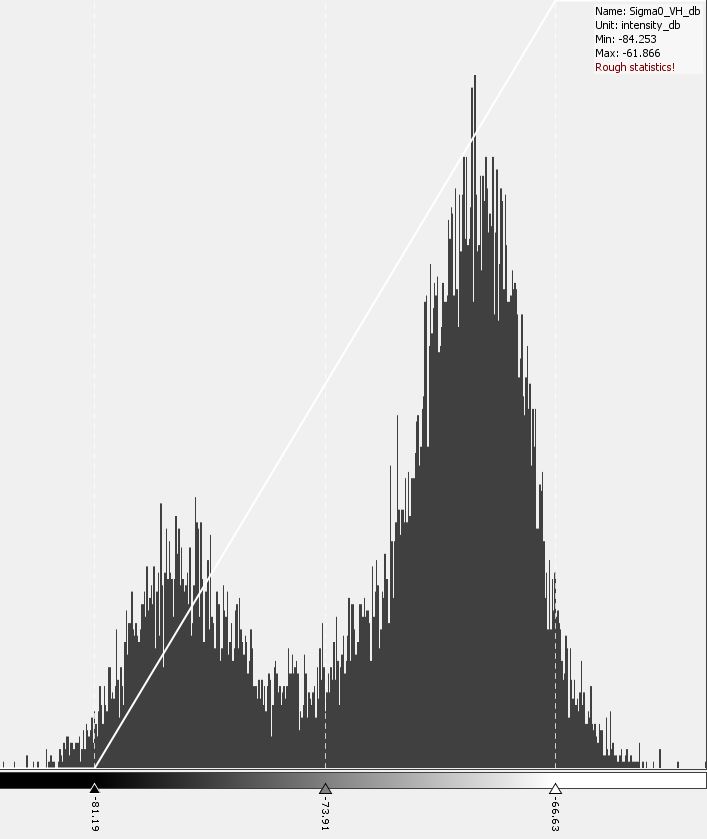
orbit file>calibrtion(beta naught)>Terrain Flattening>speckle filtering>TC(radiometrically normalized to sigmma naught). It’s min and max values in histogram looks like :
May I know why there is difference in min and max values of the histogram ? Is this due to the Terrain flattening or else what exactly brought this difference in this case?
your second workflow makes little sense. Once you calibrated to Gamma0 (after Terrain Flattening), your calibration already reached the best level possible (in SNAP). Applying normalization in the Terrain Correction step over-estimates the impact of incidence angles on backscatter intensity.
I tried to explain it in my own words here: Radiometric & Geometric Correction Workflow
The checkbox in the TC module is quite outdated, please see the comment of Luis here: S1 radiometric correction I made a similar comparison in this topic, the discussions might be interesting to you.
can you tell me how second work flow dominates the first one in order to classify the water ? If I remove the normalization in the second work flow will it be much more effective to classify water ?
The histograms look alike, so I don’t think you would be able to extract dark areas better.
Why don’t you just try and compare? Use the polygon statistics, the profile tool, band differencing…
As long as you don’t test for your specific case (you have already calculated the data), we can only guess.