yes, once the split script was executed correctly, you don’t need the zip files any longer.
I have no idea why the export fails, as this is a rather easy step. Maybe @mdelgado can think of a resaosn?
yes, once the split script was executed correctly, you don’t need the zip files any longer.
I have no idea why the export fails, as this is a rather easy step. Maybe @mdelgado can think of a resaosn?
can you please specify what exactly you refer to? This topic contains over 500 posts, so a bit context would be helpful.
I plot (‘v-s’, 4) with 200000 PS processed, in order to have a good picture of the pattern i should fixe std=0.5 , isn’t it ???
no, you cannot set the standard deviation here. You simply plot the temporal variation of each point
I’m going to put this here, because nobody has solved it for me in the original post:
I have follow the comments and indeed it makes no sense for me that stamps_export fails.
Which SNAP version do you use? Can you please share your python and graph of that step? It should not need any DEM to do that operation… so not sure what is going on in there… but seems not doing what it should.
I am using SNAP.6.0 and Python 2.7 version,I have also attached a graph of the stamps_export step.
export (1).xml (1.1 KB)
regardless of this error, I highly recommend updating to SNAP 8.
Chances are good that it fixes some of the experienced issues.
I have update SNAP.6.0 to SNAP 8 before, in cloudtoolbox, but they advised me to downgrade it because this version did not work at all. 
xml does not include any operator that uses DEMs… so not clue with your computer is doing.
So ,what should I do to fix this problem?
Dear @ABraun, @mdelgado , @thho
I would like to do my PSInSAR treatment via SNAP2stamps,
so my data is from 10/2015 till 12/ 2018 , when I split them it doesn’t have the same split , so I divided the PS treatment into two : the first one from (10/2015 to 05/ 2017 ) and the second one from ( 06/2017 - 12/ 2018) , finally I merged the two treatment into one file. csv
I want to know if my raisonnement is true and my time series is correct.
Cheers.
can you please clarify what you mean with “when I split them it doesn’t have the same split”?
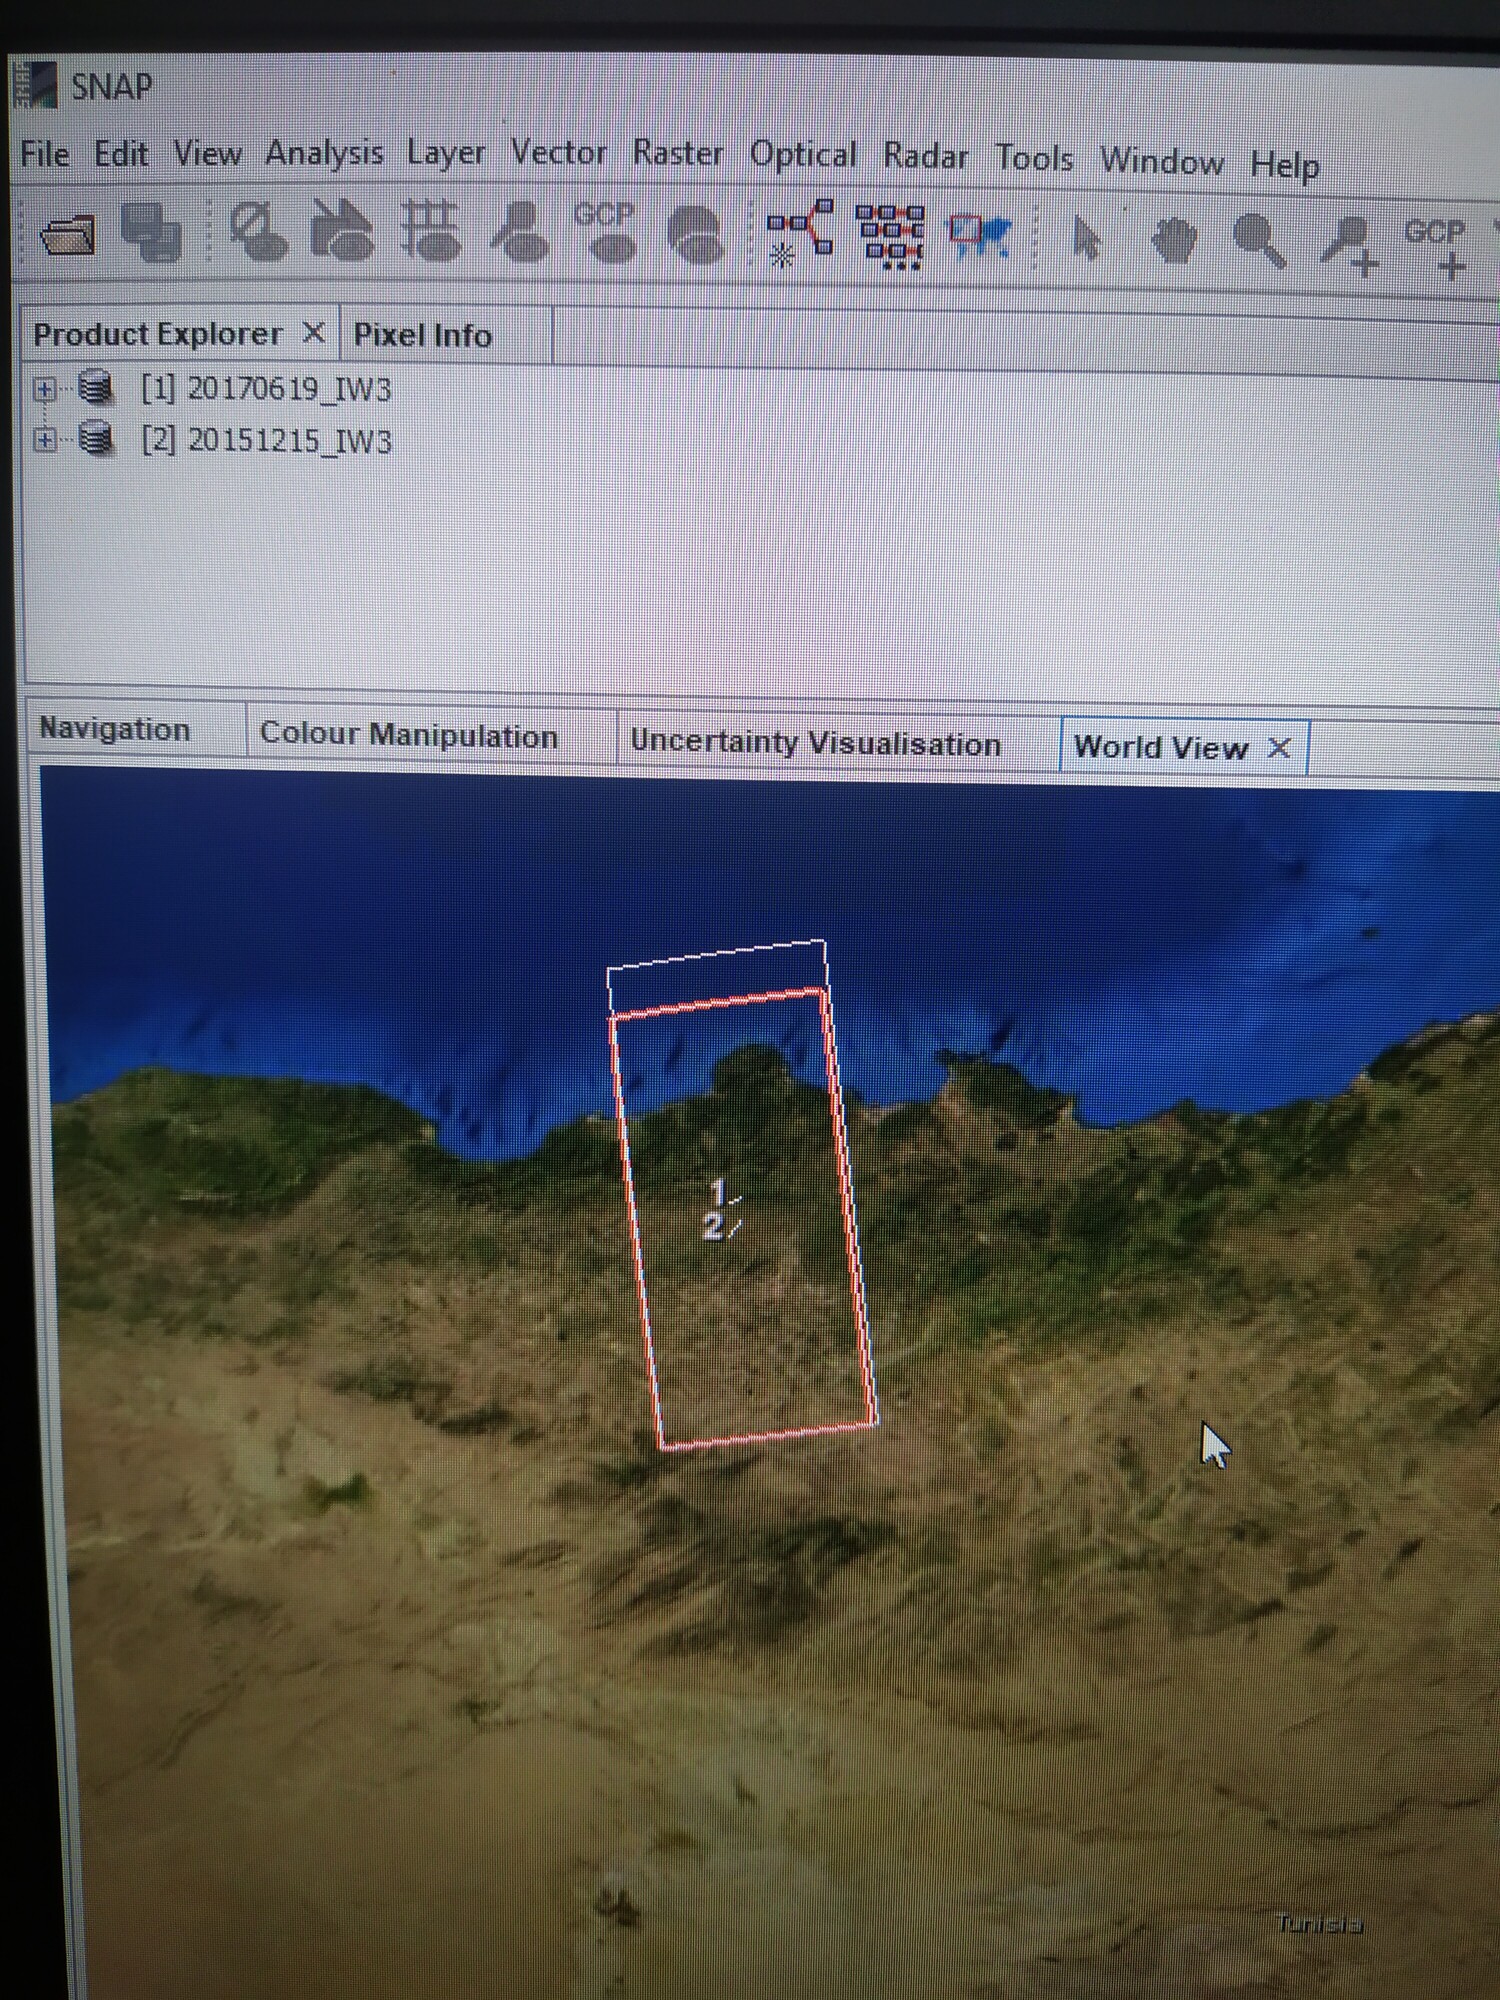
@mdelgado @thho here is an example of what I want to Say .
All the images that look like 2017
I treated alone , and what it looks like 2015 I treated alone , After that I merged the both results in the same .csv file to plot it . IS it correct what I have done
this should not be a problem, as long as the area where you want to extract information is covered by both images and the interferogram contains valid values (non-zero).
If you split the entire period into two parts, this affects the density and stability of your PS candidates, because in the initial step (mt_prep_snap), the amplitude dispersion is calculated based on the entire time series. If you have two different time series, the density of points can be different for both parts, which leads to lower comparability.
sorry, I don’t understand what you mean.
I understand that I couldn’t merge those results , I will have false interpretation
@ABraun @mdelgado @thho
if I want to merge the two results , How can I progress the 3 rd col (*.csv) that include mean velocities, shall I calculate the average of the two results into one
if you expect linear deformation you could take the average, but if the two periods show different averages you will lose information.
I again suggest to put all products into one time series instead of splitting the period into two parts.