ok looks good, and within the csv is like it is exported from matlab with the file ending .csv?
Edit: I suspect there is maybe an other file in the folder…maybe a hidden file, can you check this…
ok looks good, and within the csv is like it is exported from matlab with the file ending .csv?
Edit: I suspect there is maybe an other file in the folder…maybe a hidden file, can you check this…
more than one? that is the problem I guess…I should change the behaviour of this, to make the import more intuitive…if you like, open an issue on github…otherwise I might forget about it
i was just about to reply to you that the 2 files could be the problem, this is indeed the case. i switched them over to separate folders and the app launches correctly now, although my pc crashes for some reason.
i am researching post fire seasonal permafrost degradation change so having both files in 1 project could indeed be helpful. I will make an issue on github, thanks for the fast replies!
the crashing might be because you try to open a file with a lot of points…a lot of points is a bit hard to tell what that means, but over 500 might be a first guess where performance problems could occur…it also depends on your hardware…
and I will have a look at this thing with the projects and so on…I think getting rid of the subfolders and just put all csv into one folder is fine and easier to handle, since most files with project names are similar and will be listed next to each other anyway.
there are around 50000 points so this could be the reason for sure, i now ran the program on my linux box that has shit hardware so i will try it on my windows laptop next. but part of the reason of why i have so many point is that i have yet to find a way to limit the amount of ps points based on coherence, i will get back to you soon. thanks for the program and help!
if that helps you, define subset areas (as polygons) of your study site and subset them spatially using the script in the manual… another way is to build a spatial object, like a geojson file from the csv table and have a look at them in qgis…qgis is better in handling vector visualization…drawback is, you do not have a tool where you can have this kind of time series visualization…but there are some plugins for that, they are also discussed in this thread.
here is an R script which you can use to create spatial objects from the csv table exported with my matlab script
I have just changed the handling, you now have to put the csv tables into the stusi folder. The file names define the names in the select menu in the app…cutting the .csv file ending ofcourse. The changed version is on github

Hi @thho,
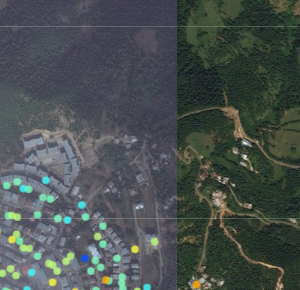
I faced cloudy image in my working area. Right side is clear and left side is cloudy. Is there any way to change image or image date?
Thank you.
@volkan within the app some geotile providers are defined…it is the server.R script line 101 to 104 in git commit ecff260b87ff90677454b3e4c6e9119628c31d78
addTiles(group = "OSM Map") %>%
    addProviderTiles('Esri.WorldImagery', group = "Satellite") %>%
        addLayersControl(
        baseGroups = c("Satellite", "OSM Map"),
the image tiles are from Esri.WorldImagery thus you do not have any control about what image you see as it is defined by the provided tile server…but there are many provider and most of them are accessible even via qgis, you can import them there with this script by running it within the python console in qgis. What you can do is:
another hint, if you want to maipulate your map concerning the point size…
atm it is not possible to change point size via gui…since I hardcoded the size. But if you want, probably, smaller points, just change the number in line 129 in server.R below the snipped shows how the markes are defined, the line with radius = 5, is the size of the points…just make it smaller to make the size smaller…
      addCircleMarkers(ps.loc[[stusi.ind]]$lon,
                 ps.loc[[stusi.ind]]$lat,
                 layerId = ps.loc[[stusi.ind]]$uid,
                 radius=5,
                 fillColor = colramp[as.numeric(cut(disp, breaks = 10))],
                 fillOpacity = 0.8, stroke = F,
                 group = "Measurement Points") %>%
New git push, now Google satellite is also available via WMS tiles. @volkan maybe you are lucky with this images. Selction via layer selection menue top left.
pfff in order to define a proper attribution of the google layer, I read that it is not allowed to add google tiles via an undocumented API…whatsoever…I started reading the ToS but really do not want to, if anybody has experience if it now is allowed to do this or not, your knowledge is very welcome…long story short, I commented the lines out and gave some hints how to add WMS tiles in the comments…wether you include google wms is up to you
Thank you @thho,
My area is only visible at Google Hybrid. Except Google Earth, my area is invisible with layers at qgis_basemaps.py. I downloaded new github version but I can’t see any changes in selection menu at the upper left.
I have no experience that kind of things, they are very far far to me. I think I am very lucky for the clouds at my working area. 
yeah as I wrote, I had to comment the lines out again…
greetings all,
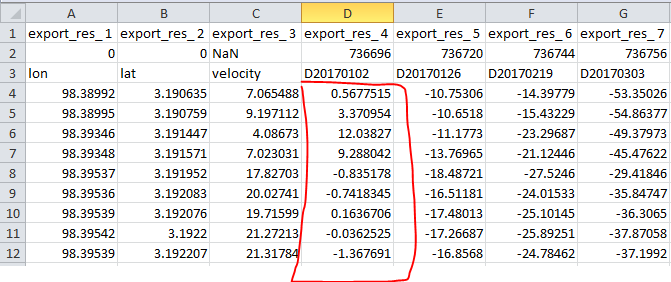
i would like to ask about file csv from the result of stamps, what is the units of column velocity? is it mm/year? and what is the number in the column Dyyyymmdd? any responds would be helpful. thank you 
The date is explained here:
About the velocity: is mm/year calculated as described here/ StaMPS-Visualizer, SNAP-StaMPS Workflow
thank you @ABraun for the respond 
no i mean the row after that (Dyyyymmdd). what is that? and i want to ask, so i’ve already processed the stamps and i want to validate the velocity from ps with velocity from gps data. is it possible? because velocity from ps are LOS displacement, right?
Can you provide a screenshot? I do not know which row you talking about.
this one
Ah ok, this and all columns following holding the mm displacement values. No velocity but the LOS displacement values derived from the interferograms.
Anyway, why does this row 3 appears in you csv file? have you inserted it by yourself? I can not remember, that this row is in there, or do I miss something?
yes I inserted it manually. thank you @thho for your respond 
i want to ask again, i’m sorry if the question is different from the topic of this forum, if we choose different master image, will it shows different LOS displacement results?