New git push, now Google satellite is also available via WMS tiles. @volkan maybe you are lucky with this images. Selction via layer selection menue top left.
2 Likes
pfff in order to define a proper attribution of the google layer, I read that it is not allowed to add google tiles via an undocumented API…whatsoever…I started reading the ToS but really do not want to, if anybody has experience if it now is allowed to do this or not, your knowledge is very welcome…long story short, I commented the lines out and gave some hints how to add WMS tiles in the comments…wether you include google wms is up to you
Thank you @thho,
My area is only visible at Google Hybrid. Except Google Earth, my area is invisible with layers at qgis_basemaps.py. I downloaded new github version but I can’t see any changes in selection menu at the upper left.
I have no experience that kind of things, they are very far far to me. I think I am very lucky for the clouds at my working area. 
yeah as I wrote, I had to comment the lines out again…
greetings all,
i would like to ask about file csv from the result of stamps, what is the units of column velocity? is it mm/year? and what is the number in the column Dyyyymmdd? any responds would be helpful. thank you 
The date is explained here:
About the velocity: is mm/year calculated as described here/ StaMPS-Visualizer, SNAP-StaMPS Workflow - #7 by thho
1 Like
thank you @ABraun for the respond
no i mean the row after that (Dyyyymmdd). what is that? and i want to ask, so i’ve already processed the stamps and i want to validate the velocity from ps with velocity from gps data. is it possible? because velocity from ps are LOS displacement, right?
Can you provide a screenshot? I do not know which row you talking about.
this one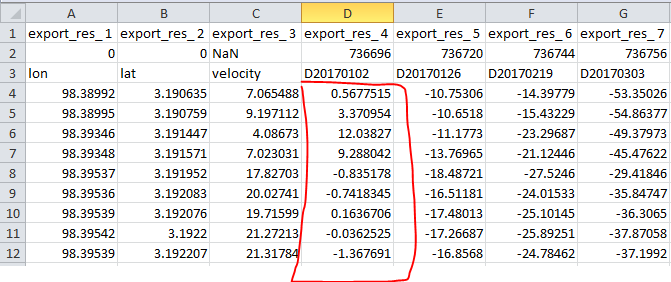
Ah ok, this and all columns following holding the mm displacement values. No velocity but the LOS displacement values derived from the interferograms.
Anyway, why does this row 3 appears in you csv file? have you inserted it by yourself? I can not remember, that this row is in there, or do I miss something?
yes I inserted it manually. thank you @thho for your respond
i want to ask again, i’m sorry if the question is different from the topic of this forum, if we choose different master image, will it shows different LOS displacement results?
1 Like
@dianalalitya have you already found out how you can obtain the vertical displacement so you can compare it with gps? If not i am glad to help and can deliver python scripts to do it with.
@thho i have read multiple times that the velocities in the csv are indeed referenced based on the reference parameter in stamps, is this true? And is there any way to obtain the mean velocity for this point?
@Gijs, I am also interested in your scripts…is github an option?
The Ref area which you define in StaMPS is used as theoretically stable signal, so yes this is true. Where you can find the mean velocity of those points exactly I do not know but somewhere in the bulk of matlab objects created by StaMPS they will probably hide…next time I am there I try to remember looking after them… it would be no problem to add them to the export csv…If you want that I remember it and work on that task, open an issue on github https://github.com/thho/StaMPS_Visualizer
@thho yeah, it would be nice if it is in there.
I am indeed working in a git that will go public after my thesis has been approved (Around half july probably). It includes a readme including my take on a start to finish SNAP and StaMPS processing ( also install etc) and a few problems people may run in to. The python scripts i used for getting vertical displacement and combining ascendjng and descending results are still quite personal and run from an interpreter so will have to know how to make a python wrapper first since i have never done that yet.
If you are interested i can share you to the git i think, still new to github.
@Gijs no i haven’t. actually i’m still confused about my result. i don’t know what to do with it. i’m still consulting with my supervisor. i’m thinking to validate the velocity displacement from gps with LOS velocity from ps-insar. but i don’t know. thank you for offering your help
1 Like
For your understanding: the LOS displacements are relative to each other and to their flight direction, so its important to set a reference point and combine ascending and descending values to make the values absolute.
After the reference point you can use the formula: LOS displacement / (cos(radians(incidence_angle)) to convert the LOS displacement to vertical displacement. When you have this vertical displacement you can combine the ascending and descending displacement by the mean of the points on the same coordinates, if you dont have both ascending amd descending on the same point you have to drop this point.
You can use the velocity from the csv files from the stamps-visualizer manual to make this all work. I will add the example scripts later when i am on my laptop.
Specifically for your case you can use the coordinates of the gps station in your aoi as reference point.
5 Likes
Had you seen the snap2stamps scripts? I guess they do similar things (maybe less) than the ones you explained.
Normally points do not match (until the last decimal on the coordinates, as for example StaMPS does not correct the point location, just get their position from the radar coordinates. In my opinion, you better search within a radius for PS points near enough to consider them as having equal or similar characteristics regarding deformation pattern. I hope this helps.
1 Like
Yes i used snap2stamps and its indeed my idea to create similar scripts but then for this task, scripts are done but will look in hoe to make them pythin wrappers looking at the snap2stamps scripts later.
I rasterize the ps points to the merge_resample_size grid and if the raster points overlap they get combined. For some cases the buffer approach may be more viable but this is dependant on your spatial variability for sure. Generalizing your data for sure isnt always the best approach and “interpolating” like this creates false spatial autocorrelation aswell. But either kriging interpolating, buffer or strict approach is a parameter i intend to implement. I would like to hear more about everyones ideas for this!
Glad to hear that you use my scripts. Please refer or acknowledge them somehow when possible. I will be happy to read about it.
Regarding searching on radius or rasterizing points, I do not see much differences, as you give an area of action to a PS point, which can be sometimes consider pretty much similar. Indeed the radius approach depends a lot on your PS density, and the radius should vary from case to case.
Discussion is welcome and I will be happy to read again about it.
Cheers
Hope it can get published but i am not quite sure of that, the paper with you and foumelis is already in my reference list so that is sorted
Cheers
1 Like