Ok I think I got it. Did you use the direct export file, created from matlab or did you use the file you changed afterwards? I think you used the changed file, which you tried to open in QGIS, this wont work…to be honest, I wrote the code not very flexible, I will change this, but until then, use the direct exported csv file, not the changed one, then everything will work, I promise 
1 Like
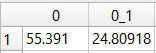
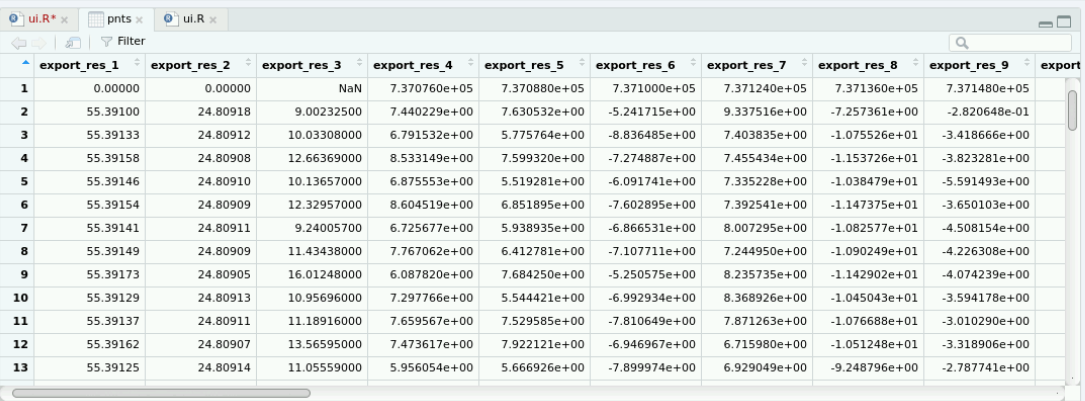
Your promise is guaranty, Yes indeed it possible to add the unedited CSV, to the QGIS, it is important to increase the number of header line to discard to choose zero as X axis, and zero_1 as y axis,
But still, with editing and without editing, the ts plugin not able to create the time series curve of any selected point.
@falahfakhri, ok I think things became a bit messed up during answering your question and @volkan’s…
@falahfakhri: In order to make a spatial subset of the exported csv table from matlab ts plot, you have to use this csv file, no editing of columns, no renaming. What you do after using the R script for subsetting is completely up to you. You can load the table into StaMPS-Visualizer, or try to get it into QGIS and this plugin you use, if you encounter problems here, try the R script I provided for @volkan to build an ESRI shape file from the csv table…we already know that building a shape file (or spatial object) using the xy tool in qgis seems to make trouble later…therfore the R script or do it in ArcGIS manually
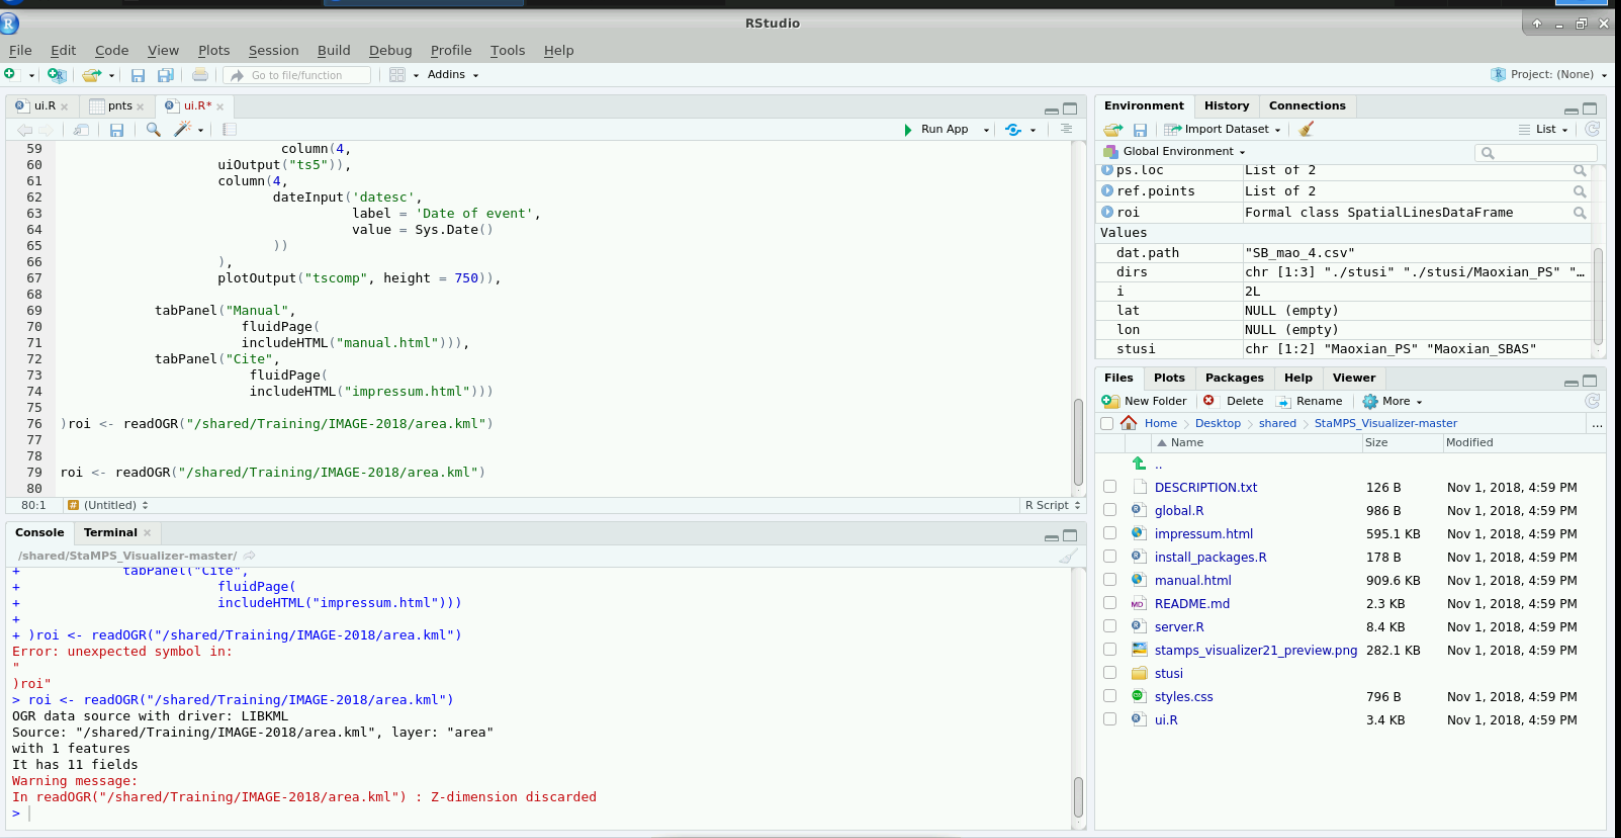
concerning your screenshot, I cant deduce what is wrong with your script, I still see, the lat lon files are empty, I also see an error which probably came from copy pasting problems of the code. I can not really check this because your script window (upper left) is showing code of the StaMPS Visualizer user interface and not the script which is meant for spatial subsetting…
Lets try not to mix things up to much, it is already difficult to follow the thread due to the mixing of the StaMPS visualizer App and the ts plugin for qgis, so lets try to ask and answer questions shortly and precisely 
cheers
Hey,
Thank you for this nice tool, i am looking into using it for my visualization but i run into a problem with making the csv in matlab.
I run below code,
ps_plot(‘v-do’, ‘ts’);
% after the plot has appeared magically, set radius and location by clicking into the plot
load parms.mat;
ps_plot(‘v-do’, -1);
load ps_plot_v-do.mat;
lon2_str = cellstr(num2str(lon2));
lat2_str = cellstr(num2str(lat2));
lonlat2_str = strcat(lon2_str, lat2_str);
lonlat_str = strcat(cellstr(num2str(lonlat(:,1))), cellstr(num2str(lonlat(:,2))));
ind = ismember(lonlat_str, lonlat2_str);
disp = ph_disp(ind);
disp_ts = ph_mm(ind,:);
export_res = [lon2 lat2 disp disp_ts];
metarow = [ref_centre_lonlat NaN transpose(day)-1];
k = 0;
export_res = [export_res(1:k,:); metarow; export_res(k+1:end,:)];
export_res = table(export_res);
writetable(export_res,‘stamps_tsexport.csv’)
and although i am not much of a matlab expert:
Lon2_Str and Lat2_str require a matrice called lon2 and lat2 but i have no lists like this as output from stamps.
does anyone have tips how can i go about to generate these input requirements?
have you set a search radius and clicked the plot to select a location? lon2 and lat2 should appear after this step.
aha, i did not see that as a step to be done by me.
sorry i just misread your instructions. thank you for your clarifications!
Greetings,
Gijs
you are welcome…seems that I should be more precise in this step…will add it
Hey @thho i had the app running for a 1 time but after closing and opening again when i added y own project i get this error:
shiny::runApp(‘INSAR/stamps_visualizer_01beta’)
Loading required package: shiny
Attaching package: ‘lubridate’
The following object is masked from ‘package:base’:
date
Error in file(file, “rt”) : invalid ‘description’ argument
do you have any clue what this implies?
i have all packages installed like you instructed.
Greetings,
Gijs
@Gijs, best guess now is, that the way you imported your own data is not as it should…how does your stusi folder looks like? when you are on Unix based OS do
cd /path/to/stusi
ls -R
and post the output.
i have made a new folder next to maoxian with my csv files in there.
file structure of ls gives:
Greenland_fire Maoxian
ok looks good, and within the csv is like it is exported from matlab with the file ending .csv?
Edit: I suspect there is maybe an other file in the folder…maybe a hidden file, can you check this…
more than one? that is the problem I guess…I should change the behaviour of this, to make the import more intuitive…if you like, open an issue on github…otherwise I might forget about it
1 Like
i was just about to reply to you that the 2 files could be the problem, this is indeed the case. i switched them over to separate folders and the app launches correctly now, although my pc crashes for some reason.
i am researching post fire seasonal permafrost degradation change so having both files in 1 project could indeed be helpful. I will make an issue on github, thanks for the fast replies!
the crashing might be because you try to open a file with a lot of points…a lot of points is a bit hard to tell what that means, but over 500 might be a first guess where performance problems could occur…it also depends on your hardware…
and I will have a look at this thing with the projects and so on…I think getting rid of the subfolders and just put all csv into one folder is fine and easier to handle, since most files with project names are similar and will be listed next to each other anyway.
1 Like
there are around 50000 points so this could be the reason for sure, i now ran the program on my linux box that has shit hardware so i will try it on my windows laptop next. but part of the reason of why i have so many point is that i have yet to find a way to limit the amount of ps points based on coherence, i will get back to you soon. thanks for the program and help!
1 Like
if that helps you, define subset areas (as polygons) of your study site and subset them spatially using the script in the manual… another way is to build a spatial object, like a geojson file from the csv table and have a look at them in qgis…qgis is better in handling vector visualization…drawback is, you do not have a tool where you can have this kind of time series visualization…but there are some plugins for that, they are also discussed in this thread.
here is an R script which you can use to create spatial objects from the csv table exported with my matlab script
I have just changed the handling, you now have to put the csv tables into the stusi folder. The file names define the names in the select menu in the app…cutting the .csv file ending ofcourse. The changed version is on github
Hi @thho,
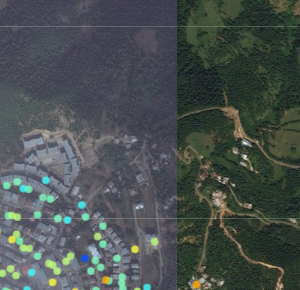
I faced cloudy image in my working area. Right side is clear and left side is cloudy. Is there any way to change image or image date?
Thank you.
@volkan within the app some geotile providers are defined…it is the server.R script line 101 to 104 in git commit ecff260b87ff90677454b3e4c6e9119628c31d78
addTiles(group = "OSM Map") %>%
    addProviderTiles('Esri.WorldImagery', group = "Satellite") %>%
        addLayersControl(
        baseGroups = c("Satellite", "OSM Map"),
the image tiles are from Esri.WorldImagery thus you do not have any control about what image you see as it is defined by the provided tile server…but there are many provider and most of them are accessible even via qgis, you can import them there with this script by running it within the python console in qgis. What you can do is:
- run the script in qgis to import the provider
- check the provider tiles (you find them in the browser panel under XYTiles I think) in your research are and zoom in level.
- If there is a provider which gives you a map you are satisfied with, you can add the provider in the script, or tell me which provider you want to add and I can try to add it…when the provider is free, it mostly is a plug and play to add another provider to the app.
another hint, if you want to maipulate your map concerning the point size…
atm it is not possible to change point size via gui…since I hardcoded the size. But if you want, probably, smaller points, just change the number in line 129 in server.R below the snipped shows how the markes are defined, the line with radius = 5, is the size of the points…just make it smaller to make the size smaller…
      addCircleMarkers(ps.loc[[stusi.ind]]$lon,
                 ps.loc[[stusi.ind]]$lat,
                 layerId = ps.loc[[stusi.ind]]$uid,
                 radius=5,
                 fillColor = colramp[as.numeric(cut(disp, breaks = 10))],
                 fillOpacity = 0.8, stroke = F,
                 group = "Measurement Points") %>%