StaMPS-Visualizer, SNAP-StaMPS Workflow

I often use the Tile+ plugin. And, yes, some places are different with respect of which tile you use. that’s why I asked, on which map does the StaMPS process rely, so this way i can choose the tiles accordingly.

Ah I see, if you like you can also add your own tiles in the visualizer, the code block is in the server script and its pretty straight forward.

Hi, I am a new entry in step forum. In these last weeks I have successfully completed the snap-StaMPS workflow for research purposes. I want to say thanks to all of you for all the advices I found here.
When I installed the “PS Time Series Viewer” QGIS plugin I had the same “no time series values found for the selected point” problem. I have solved the issue (after tryng and re-trying) in a very trivial way. I exported the data as a CSV with the tool that was provided by @thho . After that, I have made the few adjustments to the table as said @ABraun (formatting of the date and naming of the colums). Then, I have imported the .csv file with the command “add delimited text layer”. Finally, I have exported that as an ESRI shape file. At this point the shapefile is available in the layer window and the problem “no time series values found for the selected point” is arised to me. I solved this by removing the shapefile just created from the layers window and then re-add it as a new vector layer. Once do it, my problem was solved. Maybe this my experience could be useful to others.

2 Likes

thank you for sharing your solution - very helpful work-around.

1 Like

Hello,
a question has come to my mind ( maybe very stupid). When we do write the command on matlab : ps_plot(‘v-do’, ‘ts’);
what we do have after that in the stamps_export.scv are the values of the LOS velocity in mm/ year in one column, and all the deformation in the LOS direction for every date in the rest of columns.
what if I want the vertical or horizontal displacement of these points?

Did you have a look here already?

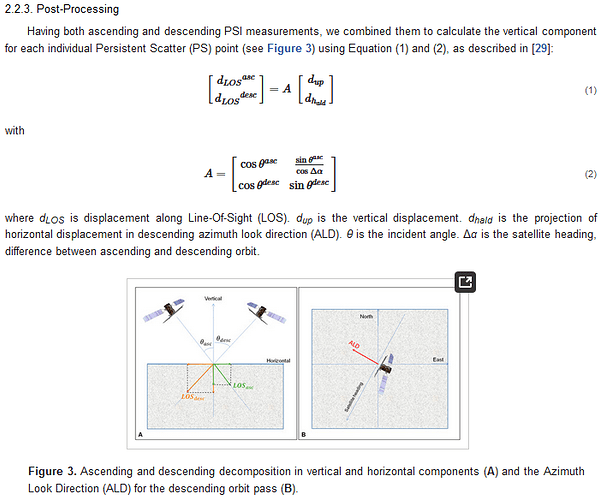
They refer to traditional DInSAR approaches, so with PS you usually need results from both ascending and descending tracks and then apply some vector calculations as suggested in this paper, for example:
1 Like

I see. I have to have necessarily both ascending and descending mode. So once you have finishe processing both modes, you select the same reference points. Does this mean you find if the results in ascending and descending modes have some points in common? otherwise you can’t use neither of the results if the points don’t correspond. But is this a bit unlikely to happen, meaning impossible to have the PS result with the same coordinates from ascending and descending mode?

yes. It’s easiest to convert them to a raster and perform the analysis on the pixels which are available for both ascending and descending.

1 Like

a question about it:
If I select my subset, is it affected by the selection of PS?
That is, the value of my displacements would change depending on the selected area, for example if I select an area of ​​100m2 as a subset, the displacement values ​​would be modified or remain the same as if I had not chosen any subset and will process the entire study area let’s put 500mm2

Thank you very much for all the guidance.
Regards

@nachin6789 I think you refer to the spatial subset in R right? This step is completely post processing after StaMPS in Matlab, the displacement values of the selected PS does not change.

I get it.
However, if I select a series of excel points from all those that I originally extracted from StaMPS and open them with the viewer, it gives me that error, hence my suspicions about the association with the PS set


all the points that I select have no displacement

however if I don’t edit the excel, the visualization seems to work correctly

hi @nachin6789,

it may be the way you select the points. I assume this is your workflow:

  • look for PS of interest in the complete csv with stamps visualizer, note down the PS point numbers
  • open the csv with libre calc and select all the lines with the points + the two header lines
  • save this selection as a new csv in the stusi folder of the visualizer

can you please provide a screenshot of the csv with the selected points? If you want you can blur out the alt lon information. Normally this should work.

@ABraun @thho Dears is there any method to add point data to StaMPS collected using GPS for landslide inventary mapping?

hi @endashdebru you mean within the visualizer? Not natively, it is possible by adding the layer manually in the server script but there is no option so far in the Visualizer…Since you are the third asking for it, I consider providing it in the next update

Thanks dear… i was in needs of integrating PS InSAR result with landslide inventory map…

Hi, does anyone know how is it possible to reverse the color bar? it should be done in MATLAB or R code

Hi @amirolinxa, in the server.R script, line 131 is:

colramp <- rev(matlab.like(10))

try to simply remove the rev() command like this

#colramp <- rev(matlab.like(10))
colramp <- matlab.like(10)

save and restart the app, let me know if this works or not
Cheers

2 Likes

To make it precise, how should the points look like? markers or colored points? Should they present an information when you hover over them with the mouse courser or something like that? do they have a time dimension like the PS points? please provide some more information about what you think those points should be presented :slight_smile:

1 Like

@thho the points are collected to show past landslide in the study are …they have no time dimension only shows their position

Ok, I think I will include it in a way, that markers are used which look different from the PS points, in order to make the difference obvious. Also, hence other users asked for points with a time dimension, I will make the landslide location without a time dimension (or event points) available in a dev branch of the visualizer, where you have to checkout from. But I will write a documentation about how to do this. During the next week, this will be available.

1 Like