Dear ABraun,
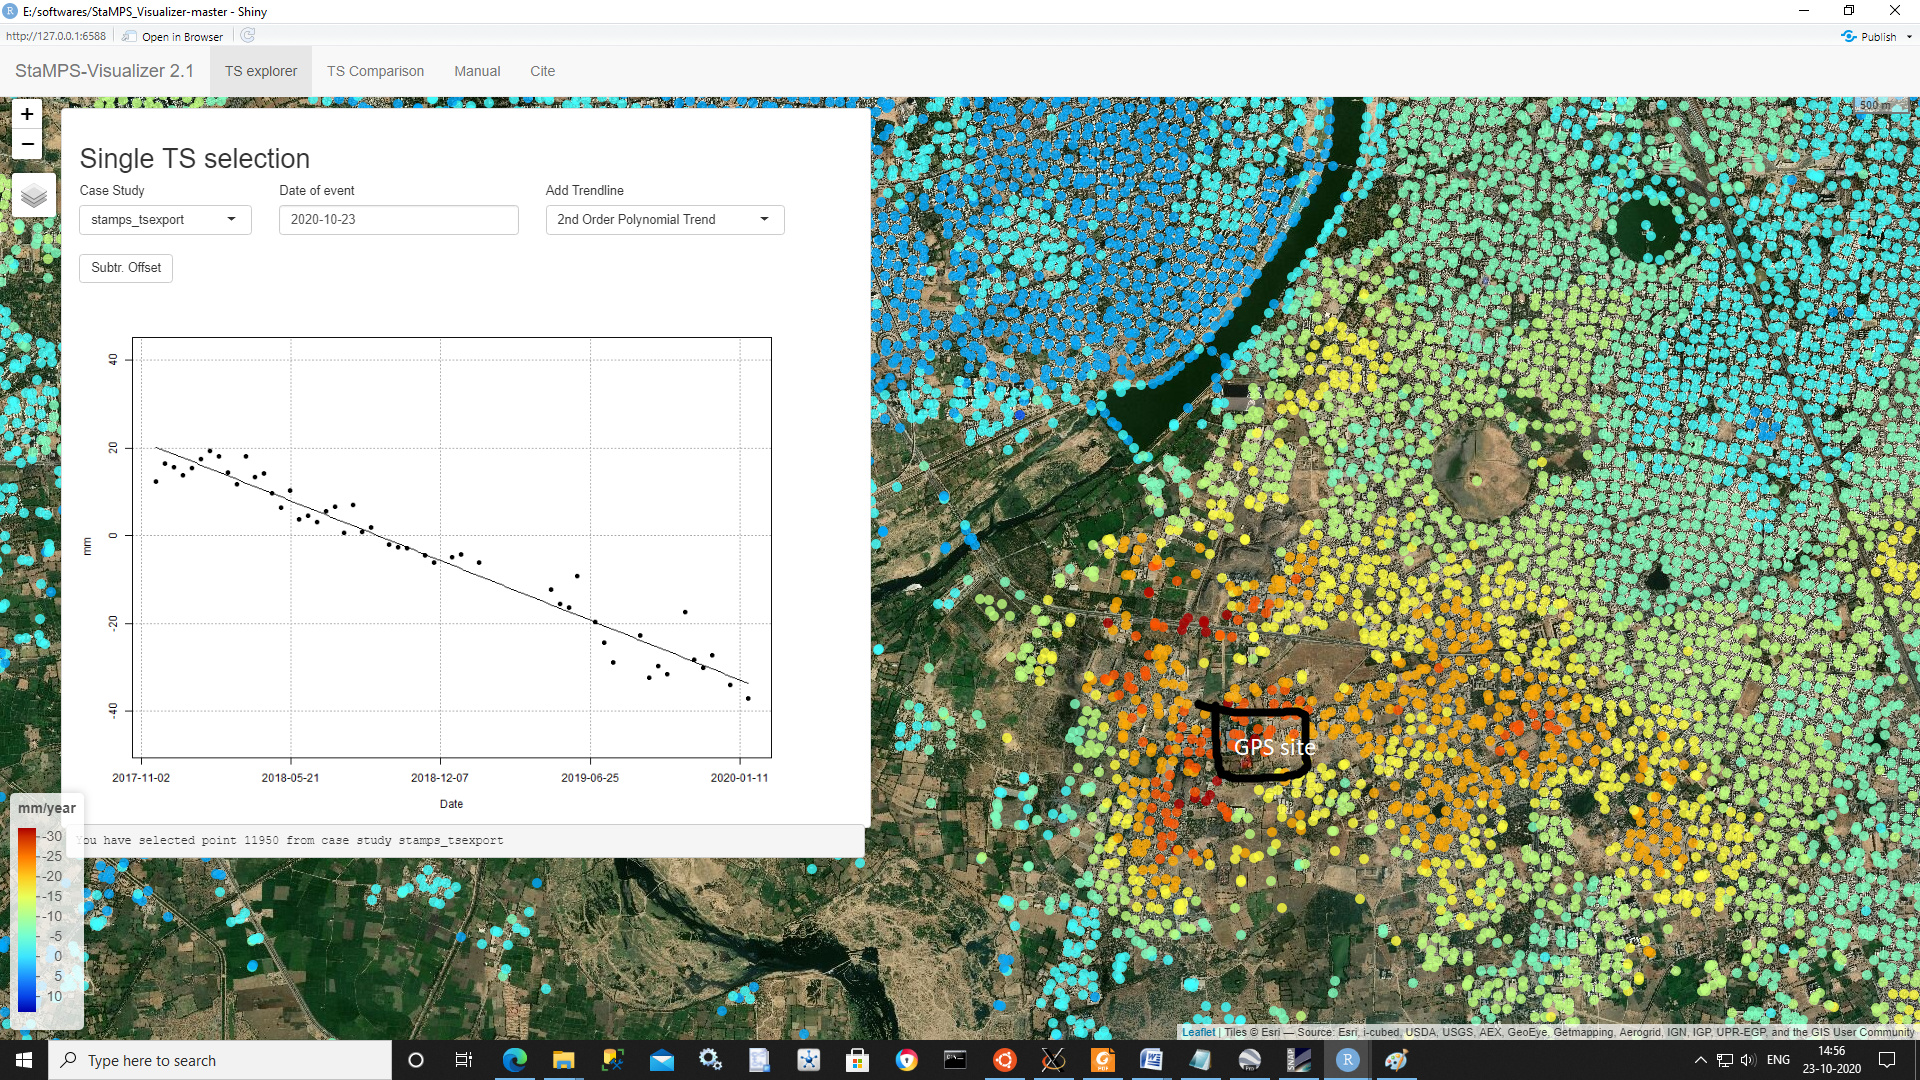
Below one is the part of my study area, wherever the subsidence happen(red colour(-10 to -24mm), in the below figure, at the same place we have a GPS station (selected in Single TS selection) running from 2 years, the time series of the GPS site also showing that subsidence at that particular area (-15mm).
Is it correct procedure to compare like this?
Thank you.
From Stamps manual:
(For plotting of velocities, the units are mm/year with positive values being towards the satellite, the sign convention for velocity was the opposite).