please set unw_grid_wrapped to 16
thank you sir I do nt get you how can I make it would you mind to clarify it ? stay blessed.
unw_grid_wrapped is a variable which is currently set to 32, which is too high for your case. You have to lower it to 16.
Please check point 4 of these instructions: https://gitlab.com/Rexthor/gis-blog/-/blob/master/StaMPS/2-4_StaMPS-steps.md
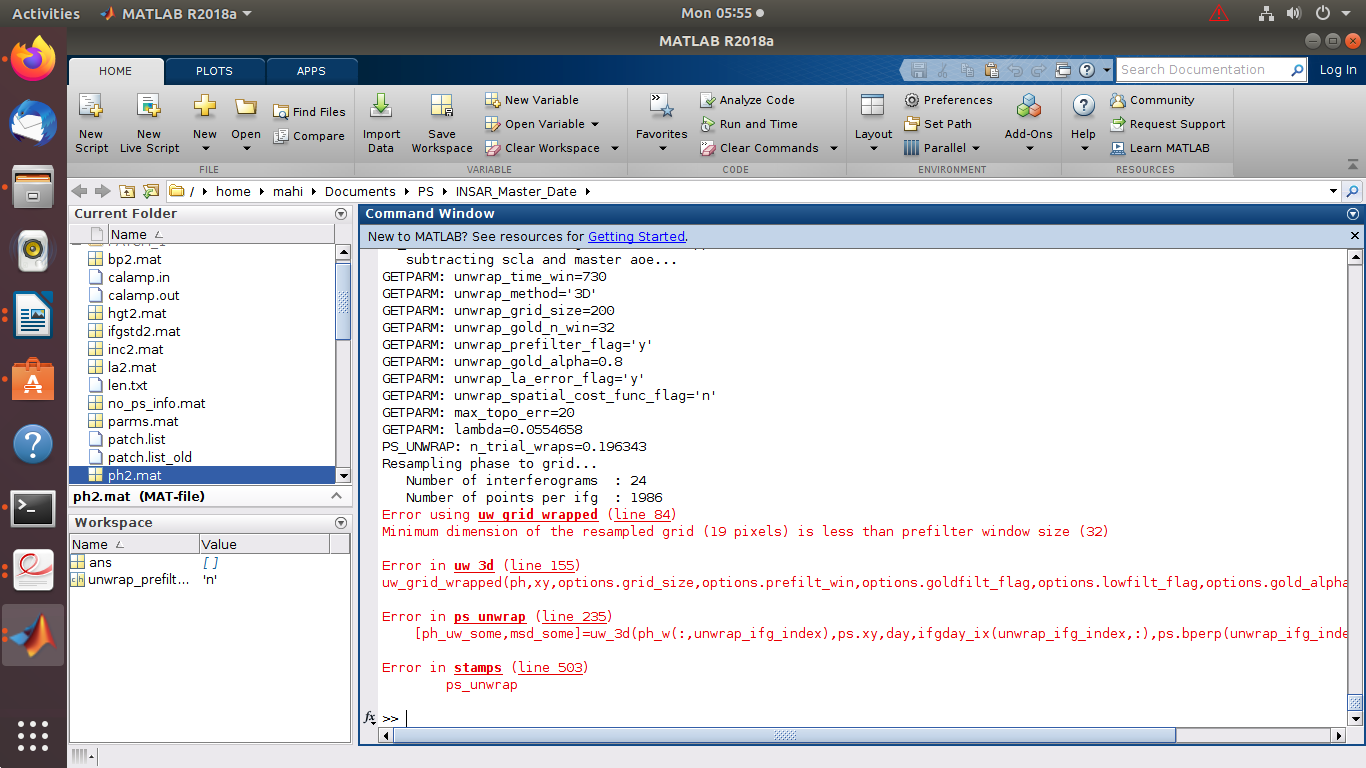
the parameter is still 32, you have to use
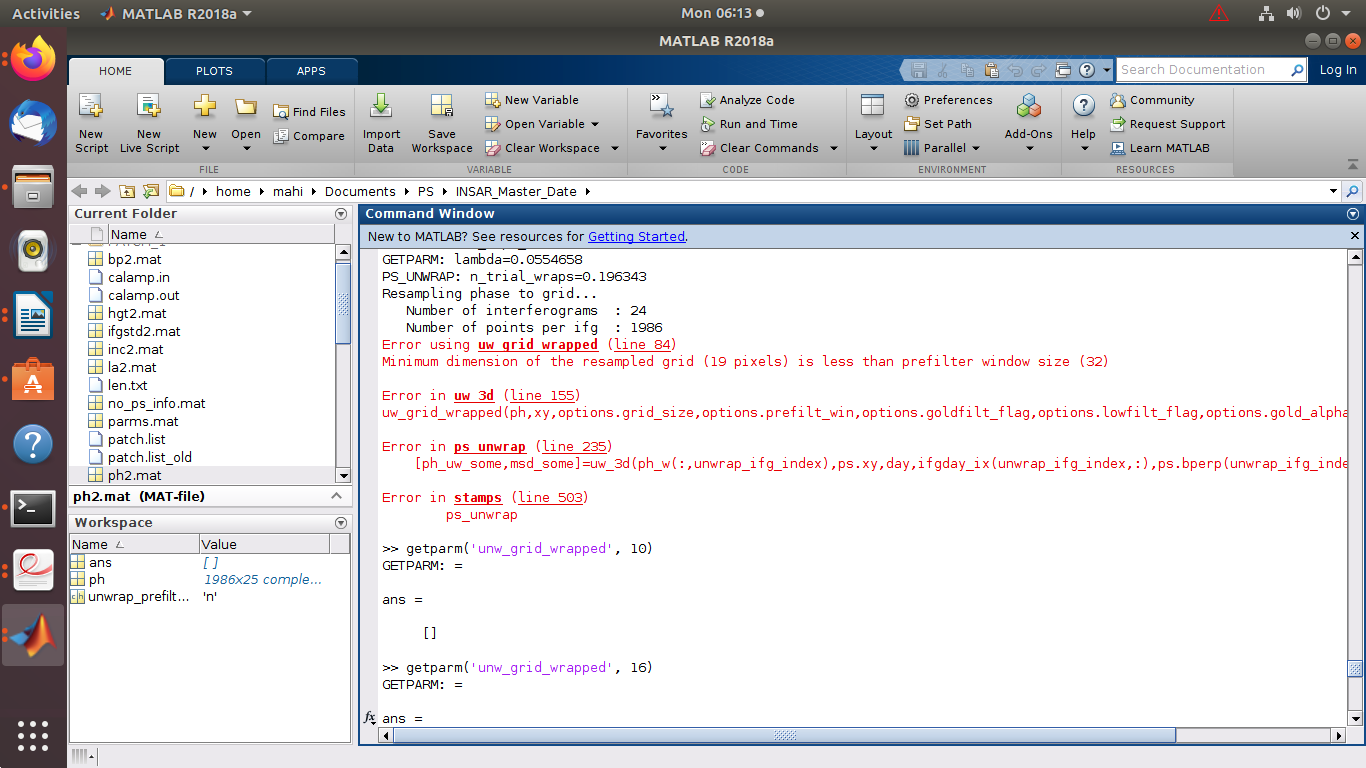
setparm('unw_grid_wrapped', 16)
I used both setparm(‘unw_grid_wrapped’, 16) and getparm(‘unw_grid_wrapped’, 16) but still the same result
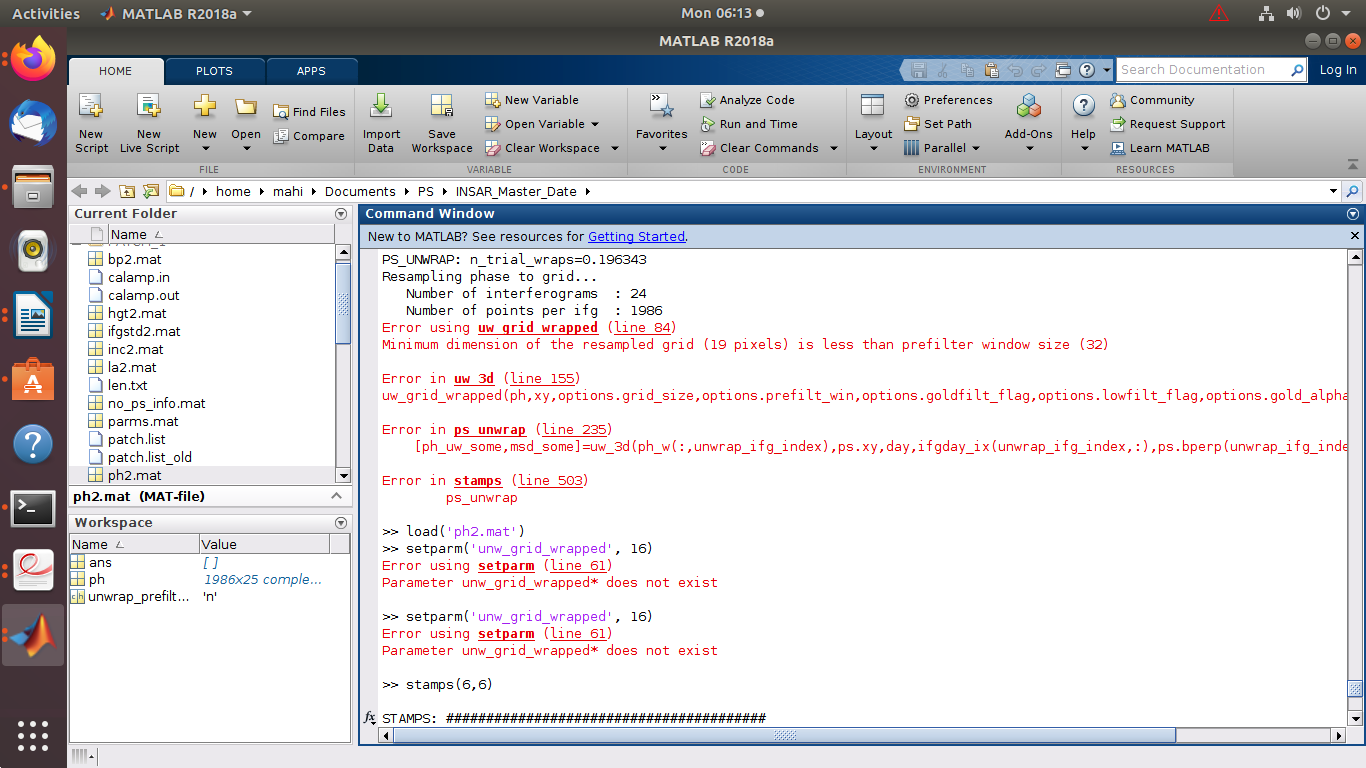
sorry, my mistake
setparm('unwrap_gold_n_win', 16)
1 Like
Thank you you are a problem solver stay blessed !
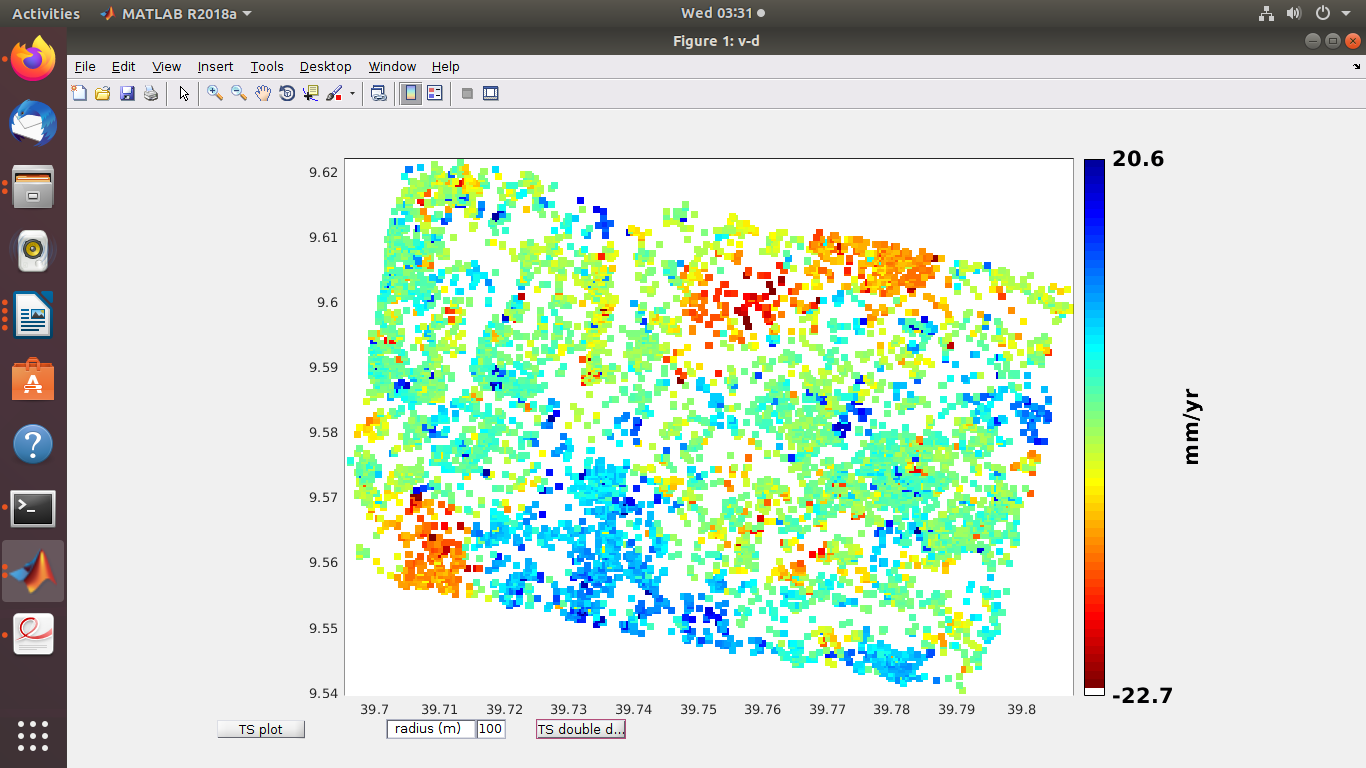
Dear Sir I cant click and plot the time series on the image TS plot and TS double not functional. in order to use the stamp visualization it is mandatory to have TS plot right? what am suppose to do?

dear Sir still nt working
As I get it right, you call ps_plot('v-do', 'ts') . Please read the StaMPS manual closely, if something does not work, try the most simplest options, in this case ps_plot('v-d', 'ts') and look if this works.
The how to use details to plot a time series plot in StaMPS are given on page 33 in the manual
https://homepages.see.leeds.ac.uk/~earahoo/stamps/StaMPS_Manual_v4.1b1.pdf
A successful ps_plot() is mandatory for the StaMPS-Visualizer export. Without a end to end successful StaMPS-processing and plot in Matlab, an export to the Visualizer is not possible.
Thank you Sir for your positive replay. the main problem ‘TS plot’ button is not working to select an area of Matlab plotting what is the problem
the TS button is not working.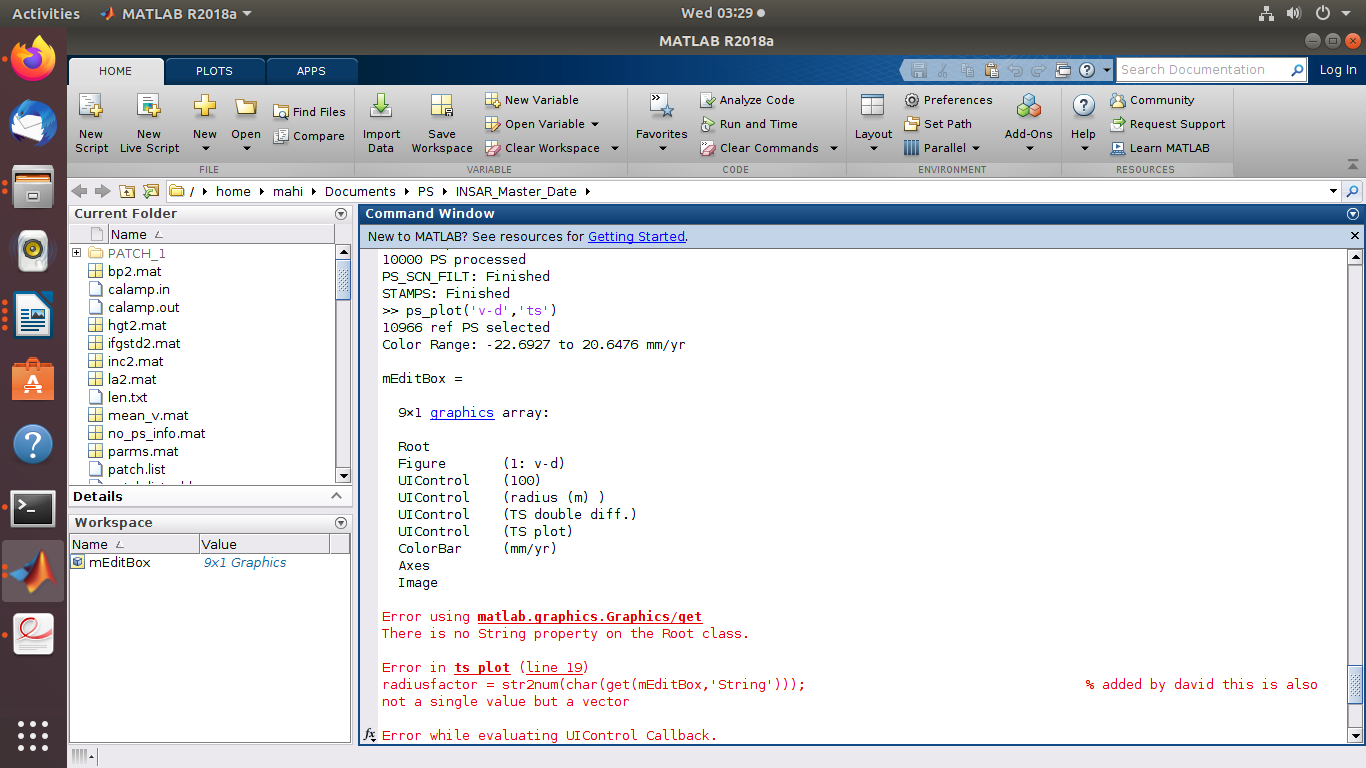
@abity that really is a strange behavior of StaMPS. Since I do not have access to Matlab, I can not try to simulate this error. And from the error messages alone, I can not tell what is the problem. At this point I can not help further. In order to solve StaMPS errors, also consider asking in the MAINSAR google group.
In this topic, the problem was resolved by installing a more recent version of matlab: Matlab Error - when I want to plot time series for a few PS points
1 Like
Dear sir I am using Mtlab2018a
do you have the chance to get a more recent version?
Dear not really I have an old version matlab 2016b the newest version is the current one am using matlab2018a
you can try using the old one and see if the error persists there
okay I will install it dear stay blessed.