dear sir I tried it with in matlab2016b but the result is the same. can I processed it again by increasing the area? or what suppose to do?
I’m sorry, but the only solution I am aware of is a newer version of matlab. Although I cannot guarantee that this will fix the error on your side as well.
Maybe a clean re-install of Matlab can already help?
okay dear in order to reinstall the MATLAB I should have to format my pc with all programs is there any mechanism with out formatting my pc to reinstall the MATLAB thanks in advanced.
please see here: https://de.mathworks.com/matlabcentral/answers/101795-how-do-i-uninstall-or-reinstall-matlab-on-a-windows-computer
Depending on your license, you should also be able to download the latest version here and enter your license information
or you apply for a test version of the latest matlab: https://mathworks.com/campaigns/products/trials.html?prodcode=ML (30 days)
Thank you dear stay blessed and stay safe! mine operating system is linux
then you are surely able to find the rountine via google yourself: https://de.mathworks.com/matlabcentral/answers/102428-how-do-i-uninstall-matlab-products-on-a-unix-or-linux-machine
Please note that this forum is mainly on the use of the ESA SNPA toolbox. We are happy to exchange about external tools and plugins, such as StaMPS or others, but we cannot guarantee technical support for all of them. At a certain point, you will also have to contact the developers of these tools, for example here: https://groups.google.com/g/mainsar
thank you very much! you are really a solution maker and life safer. wishing you long live stay blessed and stay safe.
Dear Sir I need a paper or a research work for how INSAR is a power full tools for monitoring of displacement as well as it is very crucial for preliminary investigation before the design of any development like infrastructure, buildings, road constructions etc. in order to present for layman who do nt have any basic understanding of InSAR. thank you in advanced stay blessed.
Dear All
Thanks for your attention. I have analyzed the series of descending SENTINEL-1A images with the stamps software (PS algorithm) and caught the considered results, but I think that my results are very noisy and the PS selection or weeding aren’t performed correctly (I guess that the bad PS with low coherency also are selected).
I have a question about this problem. how can I change the coherency threshold between PS points, which is considered for PS selection or weeding? which parameter or option I should change to improve the selected PS?
Best regards
there are many steps where you have impact on the selection of candidates, PS and the removal of noisy ones. The significance of all variables is nicely presented here: https://gitlab.com/Rexthor/gis-blog/-/blob/master/StaMPS/2-4_StaMPS-steps.md
In this study, we also had to deal with a very low number of initial PS. We list the parameters we changed to increase the PS density in Table 1: https://www.tandfonline.com/doi/full/10.1080/22797254.2020.1789507
hello, very good article.
I have two doubts when reading it (As the duration of each period is only one year, the size of the filter window was reduced to 60 days (contrary to the standard configuration of 365 days)):
-
why is the parameter 60 in obtaining Ps? (I understand that 365 is used for a year interpreting that the value is 361 days that contains a year, however in his work he says that for doing the analysis of a single year he uses a value of 60) I would like to clarify me why is this value chosen …
-
offers the data of the PS density obtained, how does it does this calculation?
the value determines how long the temporal window is defined to smooth the temporal trend along one PS. So with 365 all pixels within half a year before and after are used to filter the phase. As our periods were only one year in total, we reduced it to 60 days, because otherwise all images within one period would have been used for temporal filtering.
We calculated the PS density outside Matlab by converting the PS to a shapefile and calculated the number per area.
1 Like
Dear Abraun I want to have this legend for my study area 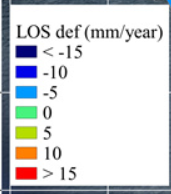
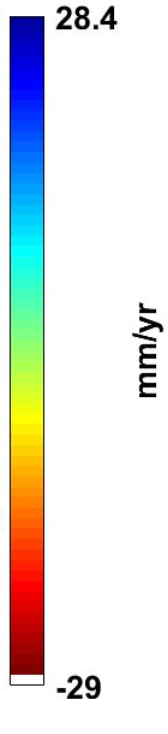
@abity In the StamPS-Visualizer server.R script
change line 16:
colramp <- rev(matlab.like(10))
to
colramp <- matlab.like(10)
3 Likes
Dear Sir I do nt know why it dos nt work properly. would you tell me the reason please.
Thank you in advanced.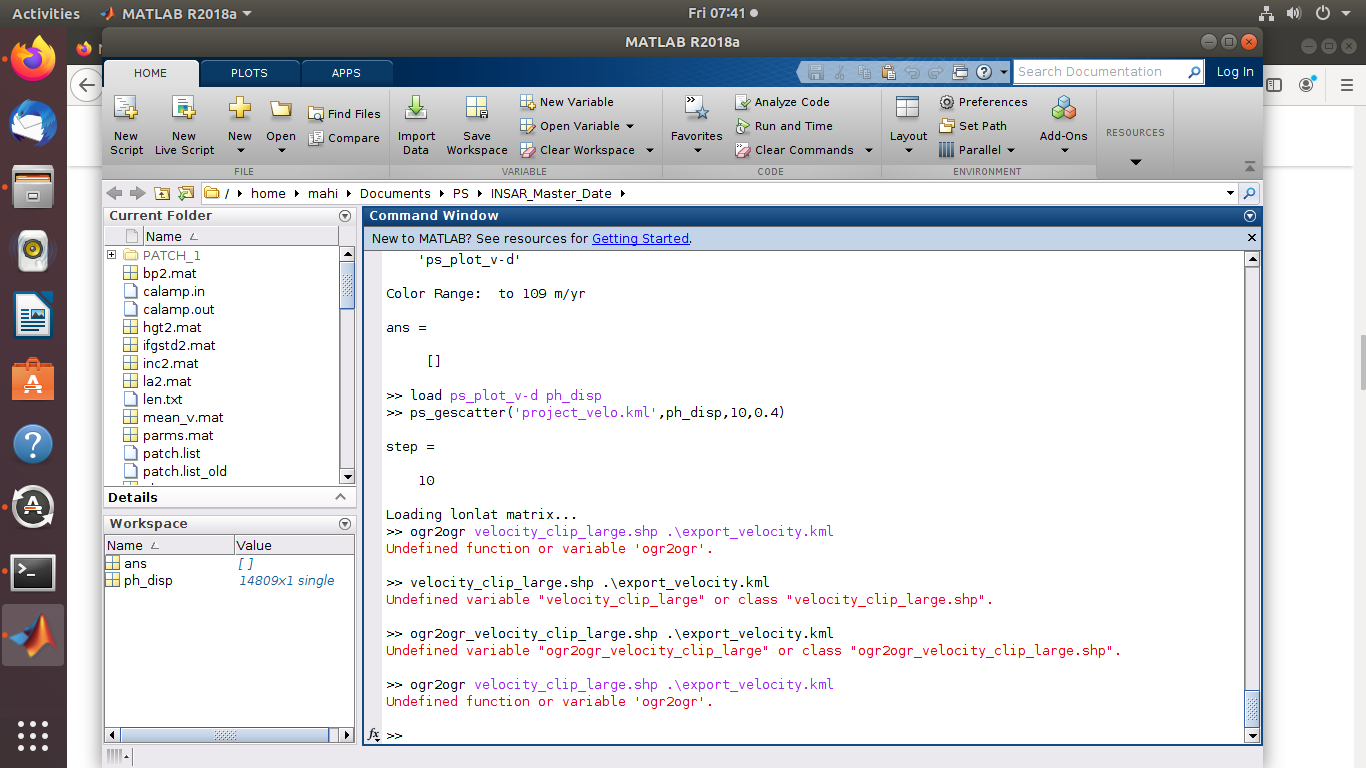
ogr commands are not callable from within Matlab, you have to install GDAL and use the command line
2 Likes
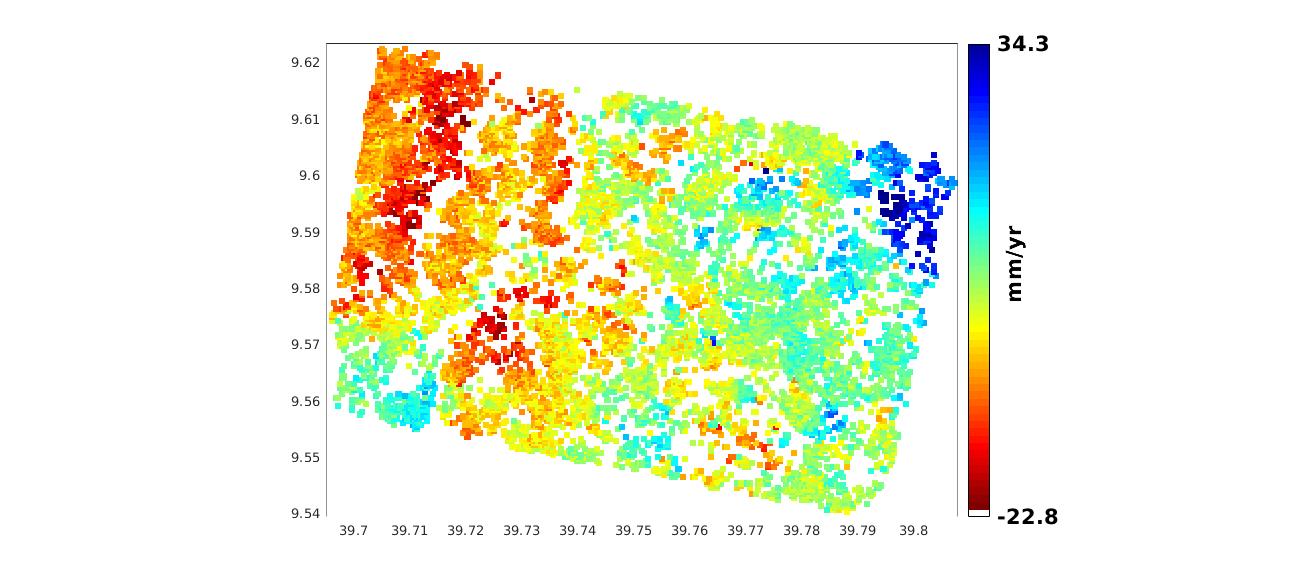
Green is around zero and red and blue indicate strong displacement. But it always depends on whether the spatial patterns make sense.
this is my study area when I interpreted it the positive number indicates that, it is along the satellite line of sight whereas the negative number shows that, away from satellite line of sight. From this, which comes first the positive one or the negative one? And also is that possible to place the displacements value like DInSAR in meter or cm ? Thank you in advanced for your each help stay blessed and stay safe.