@abity have you used the deramping approach within StaMPS during Step 7: Estimate spatially-correlated look angle erro?
Page 24 chapter 4.7
https://homepages.see.leeds.ac.uk/~earahoo/stamps/StaMPS_Manual_v4.1b1.pdf
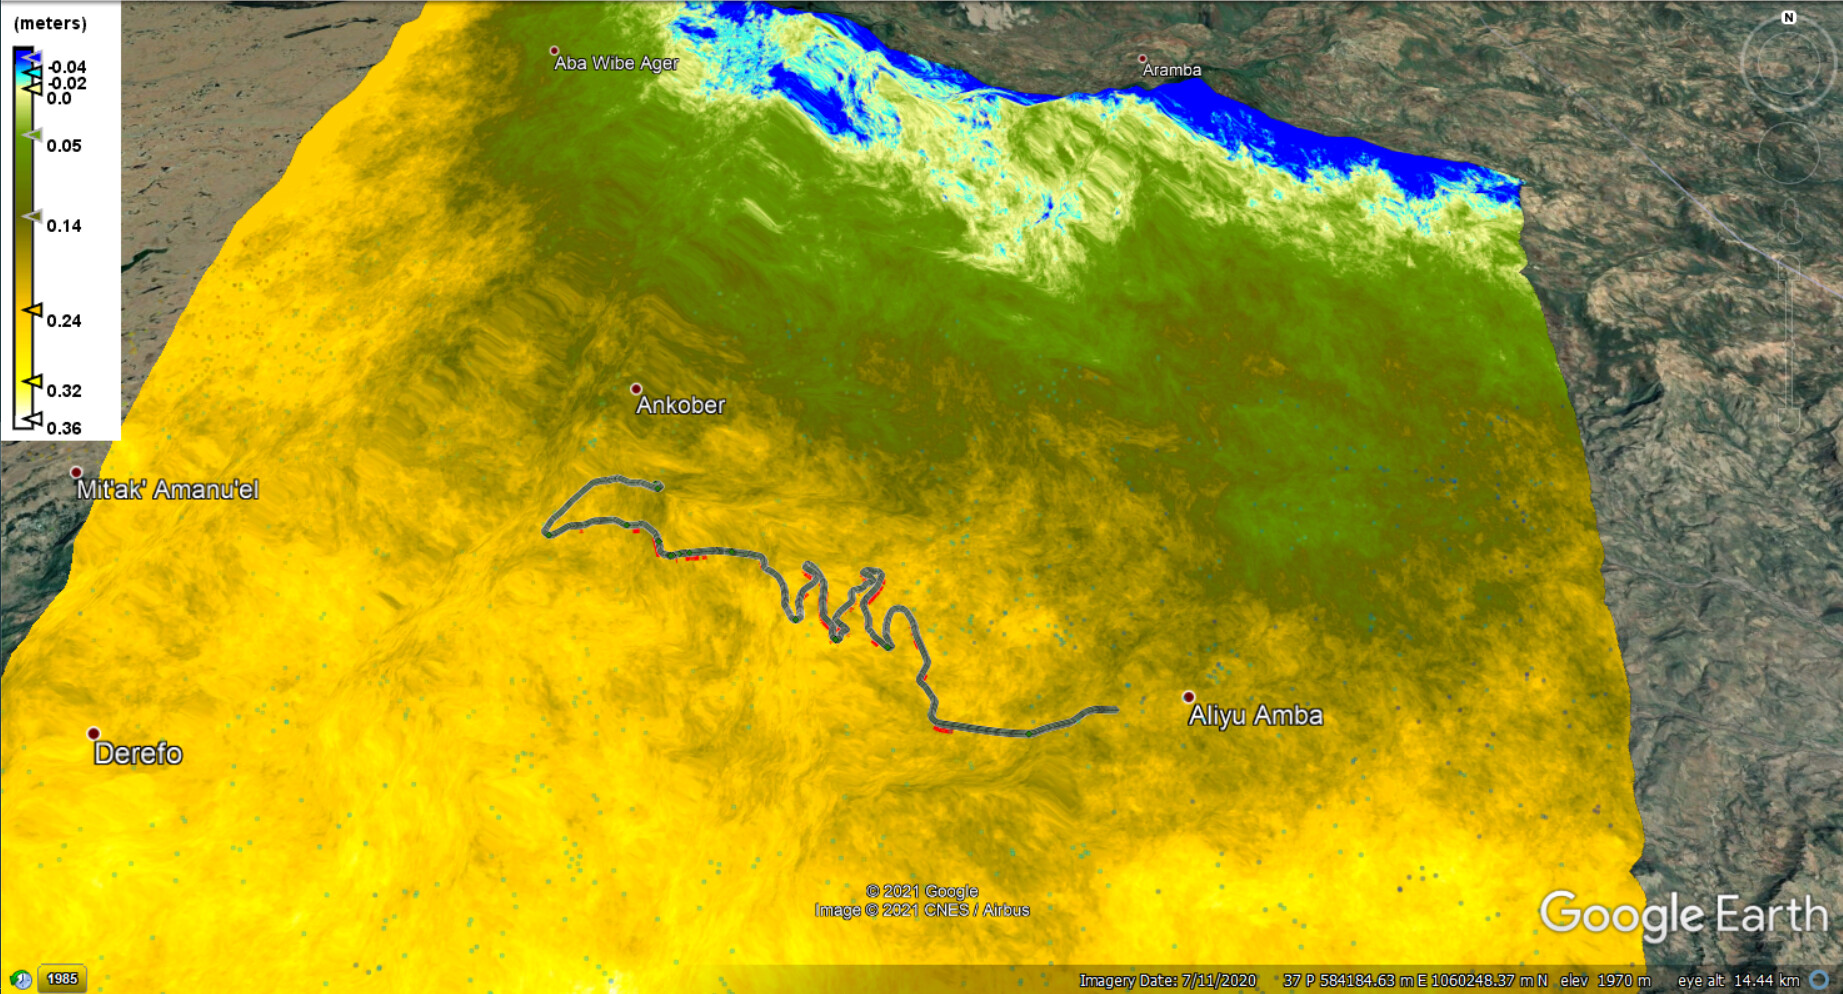
Also, as you asked to visualize the displacement signal in cm or m. In the plot you showed, to summarize the characteristics of the displacement time series, normally velocity is used. Of course you could derive the e.g. delta of displacement for each point of its own time series and visualize it like the points in your graphic with an other legend. However, since velocity is for such plots somehow a convention this might lead to false “first look” assumptions.
However, think about what you probably can not show with a single value when you try to communicate a time series. Even when some value is 0, like the delta, that doe not necessarily mean that the intermediate characteristics of the time series shows no variety. Indeed the time series can show extreme displacement (like uplift and then an steep sinking event) and your delta cloud end up to be 0…therefore, it is necessary to show both:
my recommendation is:
- velocity of all points
- selected, representative and/or extreme deformation time series which show the displacement in cumulative displacement
And that is what the StamPS-Visualizer app is meant for 
Check my thesis to sea some examples of visualization by using the Visualizer (pages 46-47, 56-57, 60-61):
I’m not sure what you mean about this?
All measurements are given along the line of sight, the positive indicate movement towards the sensor, the negative away from the sensor.
Dear Sir/madam which part of displacement is comes first? is there any hierarchy between the positive and negative?
The result as you have plotted it is a temporal average of displacements at each PS over the entire period. It does not contain any information on the variation over time, for example if there is a linear, cyclic, or abrupt deformation.
Accordingly, a value of 0 does not necessarily mean that this PS has not moved over the entire period, but that all motions result in an average of 0. If you want to get insights on the temporal dynamics you have to plot the time-series using ps_plot(‘v-do’, ‘ts’) and click on a pixel.
This is also recommended to get an idea about the amount of noise in the time-series (line-like or scattered). You cannot display both the spatial and temporal dynamics within one plot.
Does this answer your question?
Copy that Sir but how could I make it ?
I’m afraid I really don’t understand your intentions. Please specify your question or give examples on what exactly you want to do.
You can plot
- average displacements (example) as you already did
- time-series of small areas (example) to analyze how an area moved over time
- standard deviation of displacement (example) to get an idea which areas have constant deformation (low standard deviation) and which of them change their deformation rate over time.
You cannot plot a map which shows the deformation of each PS at every point in time. You have to reduce either the spatial or temporal domain.
Dear Sir,
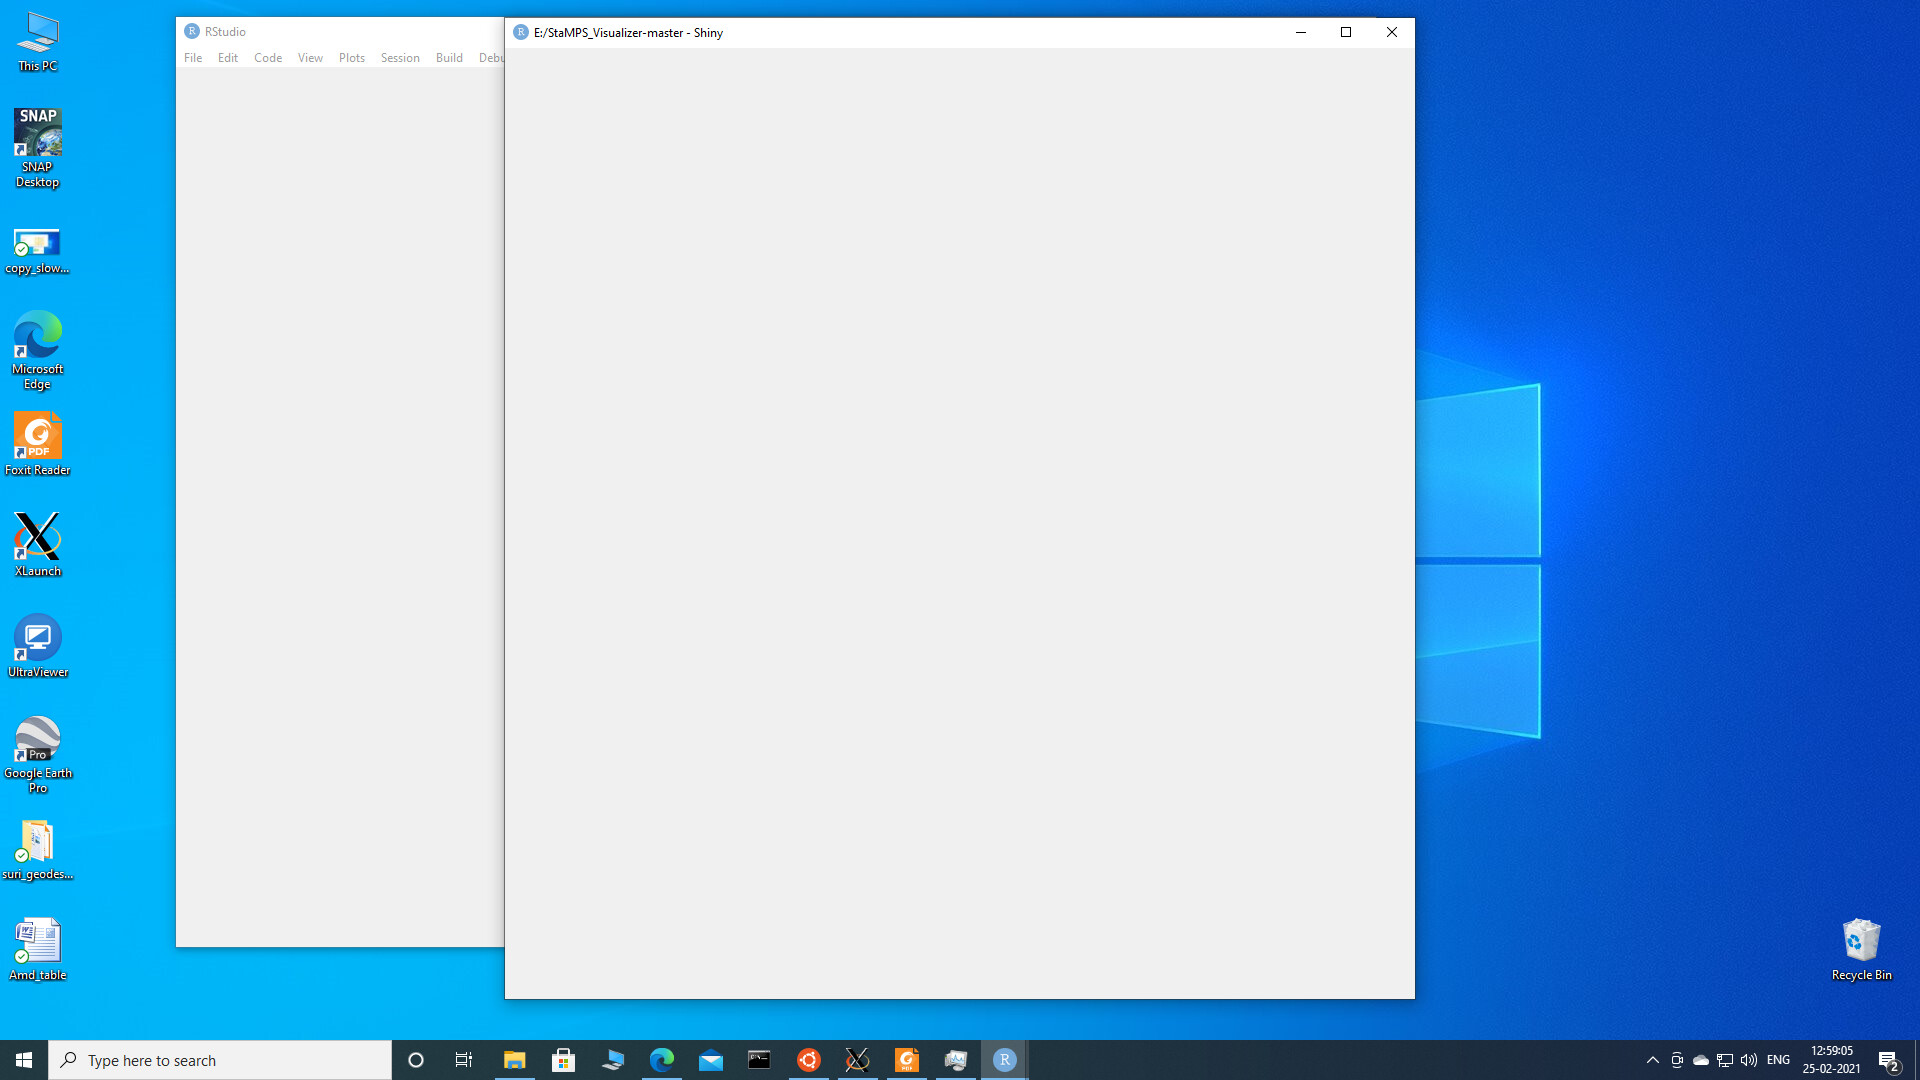
My CSV file (it contains 500000 PS) is loading in staMPS Visualizer , later it is not responding. please check it once.
@suribabu, pull the latest StamPS-Visualizer from github, your problem is discussed in the manual and settings tab of the version 3.0. 500,000 PS can be too large for given hardware, hence, make a spatial subset, this problem was discussed several times in this thread.
@suribabu, here are some posts discussing the spatial subset:
All the PS points are loaded initially then later on the screen become above. It is not showing any error. I’m using latest version and my system having 120GB RAM. Thank you i will check it.
Please keep me updated if the problem continues, the max point size is still a critical issue of the app.
Good Morning
Can someone tell me, how is the average speed of displazament, of the time series calculated?
I understand that it is:
(the initial value minus the final value of the regression line) / the amount of accumulated time of the study
Right?
Isn’t this possible only with descending images?Should both be used at the same time? Do you mean this?
If you want to resolve PS displacement for vertical movement, you need ascending and descending time series. Then you combine the temporal average of both tracks
but my Interest area has only 17 images in ascending mode,While descending mode images are much more, they are 118 images. and each must have a common path and frame.
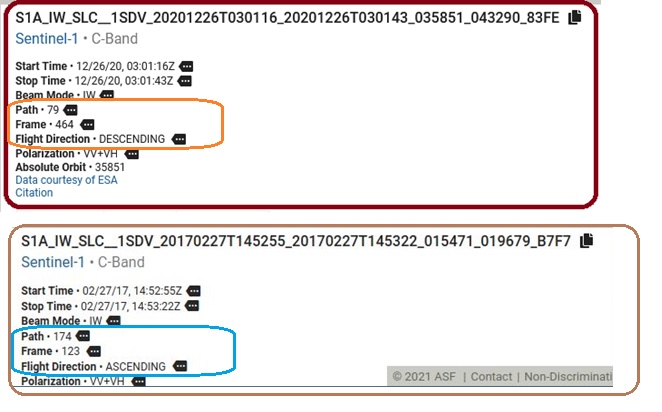
in my opinion, only the images which cover the same period can be combined
Dear all,
I hope this can help others that have encountered my same issues.
I tried to make PS Time Series Viewer plugin work in QGIS. I tried several methods but none of them worked. I also tried the code, kindly written by @thho but it didn’t work for me (I am sure the code is fine, I think it was me not being able to make it work).
I used another simpler R code, and it did work!
Please give it a try and see if you can solve your issues!:
First modify your output .csv file like the figure below (the one you obtained using in matlab the code from StaMPS-Visualizer (it should be something like stamps_tsexport.csv, unless you changed the name)) :
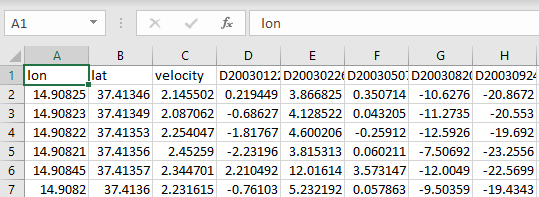
- If you don’t know how to format your .csv, please refer at this discussion StaMPS-Visualizer, SNAP-StaMPS Workflow
Then in R run this code (after changing the path and file name according to your settings):
install.packages(c("rgdal", "sp"))

library(rgdal)
library(sp)
MyData <- read.csv(file="C:/Users/INSERT_YOUR_FULL_.CSV_PATH/... .csv", header=TRUE, sep=",")
class(MyData) # data.frame
coordinates(MyData)<-~lon+lat # make sure your .csv is in the format required (i.e., lon lat velocity D...)
# data.frame
class(MyData) # [1] "SpatialPointsDataFrame"
          # attr(,"package")
          # [1] "sp"
writeOGR(MyData, "REMOVE_AND_INSERT_EXPORT_PATH", "REPLACE_WITH_OUTPUT_FILE_NAME", driver = "ESRI Shapefile")
Just import the .shp obtained from this code in QGIS and it should work!
Good luck!
@SimoneA that is pretty nice indeed 