Thanks @thho! You all have helped us all a lot. I hope I can give it some back!
2 Likes
Hello Sir I use StaMPS-Visualizer got csv file, however, the first row keep only to four decimal places,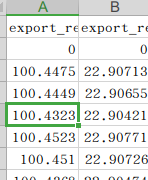 ,
,
How to increase the number of decimal places
are you sure it is not just rounded by your software? In MS Excel there is the option to adjust how many decimals are displayed ![]()
You can see that the second column obviously has more than four decimal places, so I think it should not be rounded.
Hi @weiweian, I think this has something to do how the objects are created during the matlab export. Since I do not have a Matlab license I can not run any tests at the moment. If you want to dig into this, you can run some tests and post the results here, that we can figure out how we can increase the decimal numbers aka spatial accuracy:
Some checks:
- In the Matlab script you load the matrix with the infos you want to export which was generated during the ps_plot: e.g.
load ps_plot_v-doa.mat; - within matlab on the right there should be a panel with variables, we are interested in the
lon2andlat2object. Select them to visualize their content. take a screenshot of those results, if they already show little decimal numbers, the issue lies deeper in the StaMPS code. But if they show many decimal numbers, we can check the next steps in the export script and find the issue where the decimal numbers are chopped off.
Thank you for your detailed reply,firstly. After I loaded ps_plot_v-doa.mat,I have found lon2 and lat2 have twelve decimal places. So I think it is possible that subsequent commands cause fewer decimal places.
Hi @weiweian, cool, that are good news!
Next check:
- the
lonlatobject should already exist before you continue with the export script, how do the values there look like? - after that check, you can continue with the export script, after each step, you should look on the objects you have created and when you see the decimal numbers disappear, we know which line to change
Hello @thho , Before I export, I see that lonlat has only four decimal places. After I export, I see that lonlat has five decimal places in the csv file, which is very strange to me. In addition, I don’t know how to modify the number of decimal places displayed in the matlab workspace, so I can view the above numbers by copying them into the text.
hmm I see, too bad that I do not have access to Matlab and some playground data. Without I am not able to figure out what is going on in detail and to me it sounds like that there is some thing going on with just one or two objects which have to be looked at closely…
Yes, I think so too, if I solve the problem I will come back to give the answer, anyway, have agood day Thanks again.
1 Like
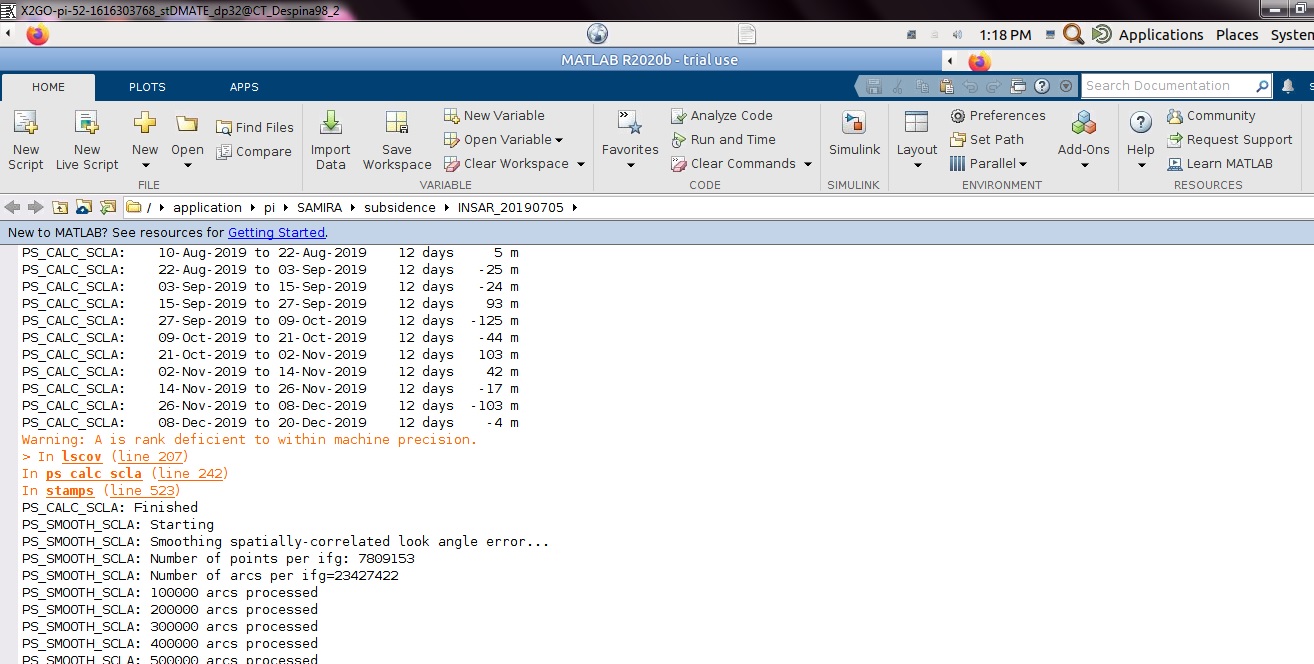
hello,
This message appears when I run stamps(7,7)
Dear Gijs,
I just processed 52 images using STAMPS, and I get LOS displacement which was exactly matching with GPS site placed over my AOI.
As per your studies we need both ascending and descending to compare the LOS with vertical displacements. But I have only descending orbit data only.
How can I compare this results ? If you have any python code for single orbit data(converts LOS to vertical ) please share it.
what’s wrong with his answer here? Documentation on SNAP-StaMPS workflow
1 Like
Nothing wrong Dear ABraun, In this below link vertical_displacement_calculator.py code is present. I want to check it this python wrapper to descending orbit data set.
Thank you.
I have used the csv file obtained by StaMPS-Vsualizer. How does StaMPS calculate the average deformation rate based on the settlement?
To which column do you refer to?
The third column,mean velocity
As far as I understand it, over the entire time period of your stack (lets say its 2 years for example), the velocity is calculated by looking at the absolute difference between the first and last point (lets say for one point that is 4mm) then you have a 2mm/yr velocity.
However, there might be other ways to calculate that. e.g. calculating the velocity for the period 1st image to prime and a second velocity for prime to last image and then the mean of both results. But as far as I remember (I looked into this in 2017/2018) It was done as described in the first option
Yes sir, you made a correct point, but there are still some differences between the average speed calculated by the first method and the value directly derived from StaMPS. I don’t know where these differences come from. Do you have any good suggestions for this, thank you!
No other than the two options I mentioned. But I looked into the MATLAB code of StaMPS and localized the lines where mean velocity is calculated:
some objects are prepraed before but the main part is from line 196 to 204:
As you can see, it is not that straight forward as described, which explaines the little differences. If you like read the script closely and when you post a summary here about how exactly the mean velocity is calculated we would all be very thankful 
2 Likes