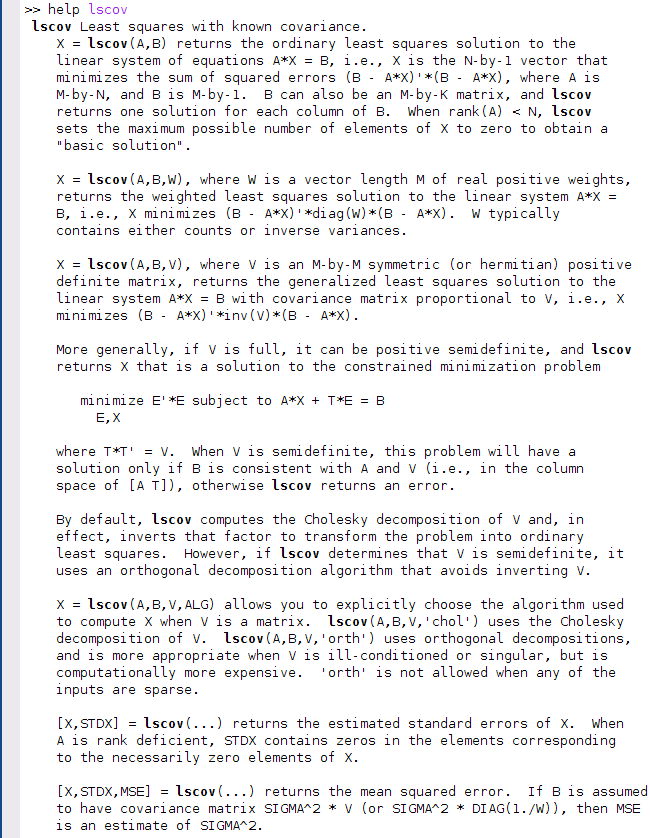
@weiweian Thanks for sharing your insights! That will help others to understand this value better. The question about the precise calculation of mean velocity came already up once or twice.
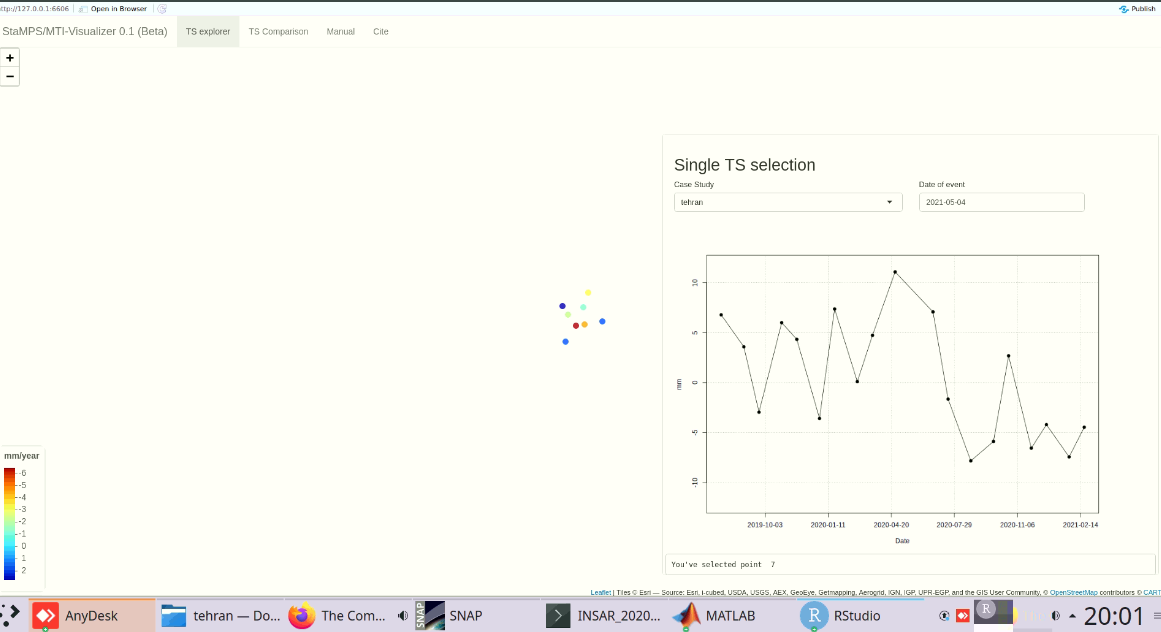
the area you select here will be the zero-displacement reference, so depending on which point you select, this will affect the legend. If nothing is defined, StaMPS takes the average displacement of the scene, but this can differ from the true zero-displacement depending on the size of the scene and the displacement pattern.
if you want to do this in StaMPS-Visualizer, this is tricky I think, here is how it works in general:
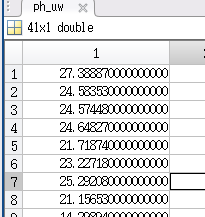
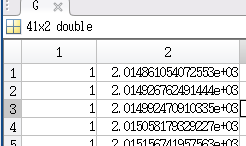
the colorramp is defined by the min and max of your displacement values which you have exported from StaMPS in Matlab.
Since the distribution can have many characteristics like all positive or negative, 90% over 0 and 10% under 0 (e.g.) the color ramp it is not designed to have a static center but to adjust to every new dataset and give a high resolution of the displacement values aka make a min-max stretch very time
the line where this is specified is:
here we take the pre defined matlab like color ramp object colramp and force the domain to be the min max of the displacement value (which can be seen as a min max stretch)
The new object colnum is later used here to set the pal parameter in the map legend:
however, the points color is defined directly via the displacement values:
So what you have to do, in order to center around 0 individually
create a custom color ramp by stacking two color ramps
first ramp is e.g. from +10 to 0; blue to white
second ramp is e.g. from 0 to -90; white to red
stack both color ramps to gain a +10 - 0 - -90; blue - white - red gradient color ramp
then, this new color ramp has to be implemented to the two cases (legend color and point color)…how to do this exactly, I have to test myself…tbh
here is a code example that can be used, it is somewhat tricky I think, at the moment I do not have the time to implement it, but I will keep it in mind for the future
if I set ref_centre_lonlat and ref_radius so take a PS as zero-displacement reference (a stable rocky outcrop, for example), when I visualize the graph of this point on StaMPS-Visualizer it will be displayed as a horizontal line at zero (translation of every point data to zero) or only the mean velocity of this PS will be set to zero, or it will affect only the legend but not the data of displacement? Will the velocities of all others PS be affected by the setting of reference point?
yes, the entire range of values will be shifted so that the area you selected as reference is zero. If this value also represents most of the unchanged areas, the legend will also be zero for this color.
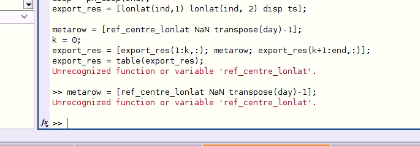
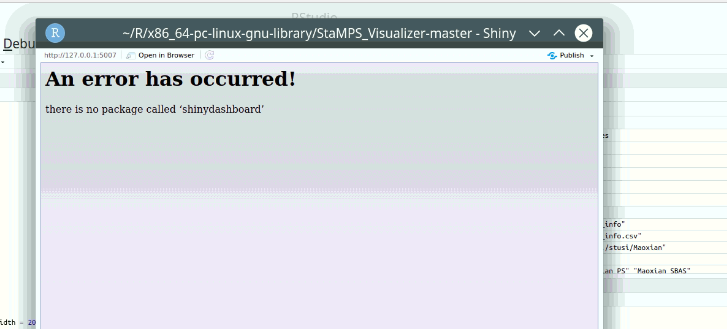
Hi dear thho; when I want to export custom data from stamps based on suggested commands in Github( stamps visualization example); I get this attached error…what does it mean?
the script is missing an object called ref_centre_lonlat.
If I remember right, this object is created during the line load parms.mat in the beginning of the script. You normally set it at the beginning of StamPS processing to define a region that is assumed to be stable and which phase values are used for reference (otherwise all displacement values are relative to a mean made from all values…which might cause strange results). However, normally, if the parameter was not set in StaMPS it should be 0,0 or something.
To solve the issue, start the script and run it line by line. In Matlab, track the objects which are created in your environment and check if the object is created properly, and also check if after each line all results are as expected…the custom export script is not the most stable lines of code I have ever written…so I advice to run it line by line and check its behaviour on your specific data.
thanks for your kind response, I could solve it, but when I try to visualize some case study results by this app, there is not a base map in the background of my ps points figure window. what can be the reason for this issue?
First, you should switch to the latest release which I moved to github, it is more stable than the very early version you are using right now. Also installation is very easy with the new version.
The reason for your white background can be caused by a too high zoom level. The newer version of the app has a layer option in the upper left corner of the map panel, there you can switch to OSM basemap which sometimes provide a higher zoom level. If you dig into the code, you can add other WMS tiles as basemap here:
Hi @thho ,
news about how StaMPS calculates the mean velocity? I have noticed the same thing, so very close values but never get the same result of mean velocity.
Hi @Giova have you seen these posts? (from the linked one and the next 4 after it)?
It is the best we have right now. It is not an entire explanation but can help to dig deeper. Atm I am shifting more and more away from InSAR in my research and can hardly find time to dig into the issue myself…so when this discussion does not develop here, the MAINSAR google group might be a better place to ask about the specific calculation of the value…Normally I take some days after Christmas and before new years eve to make an update to the StaMPS-Visualizer app…so it will take some time before I will put more focus on the issue…and this year I have to write my PhD thesis in that time, so it might shift to April 2022