Thank your dear suribabu! I found this issue derived from the StaMPS version 3.3b1, and I installed the 4.1 version, it worked.
And instead of using “mt_prep_gamma” or “mt_prep_gamma_snap”(provided from @Thorsten), just use “mt_prep_snap” that contained in the latest StaMPS update in official github repositoryhttps://github.com/dbekaert/StaMPS, and it can run correctly in MATLAB from stamps(1,1) to stamps(8,8).
2 Likes
Dear Thho,
I wanna model my InSAR data using GBIS. For that I need data format like below.
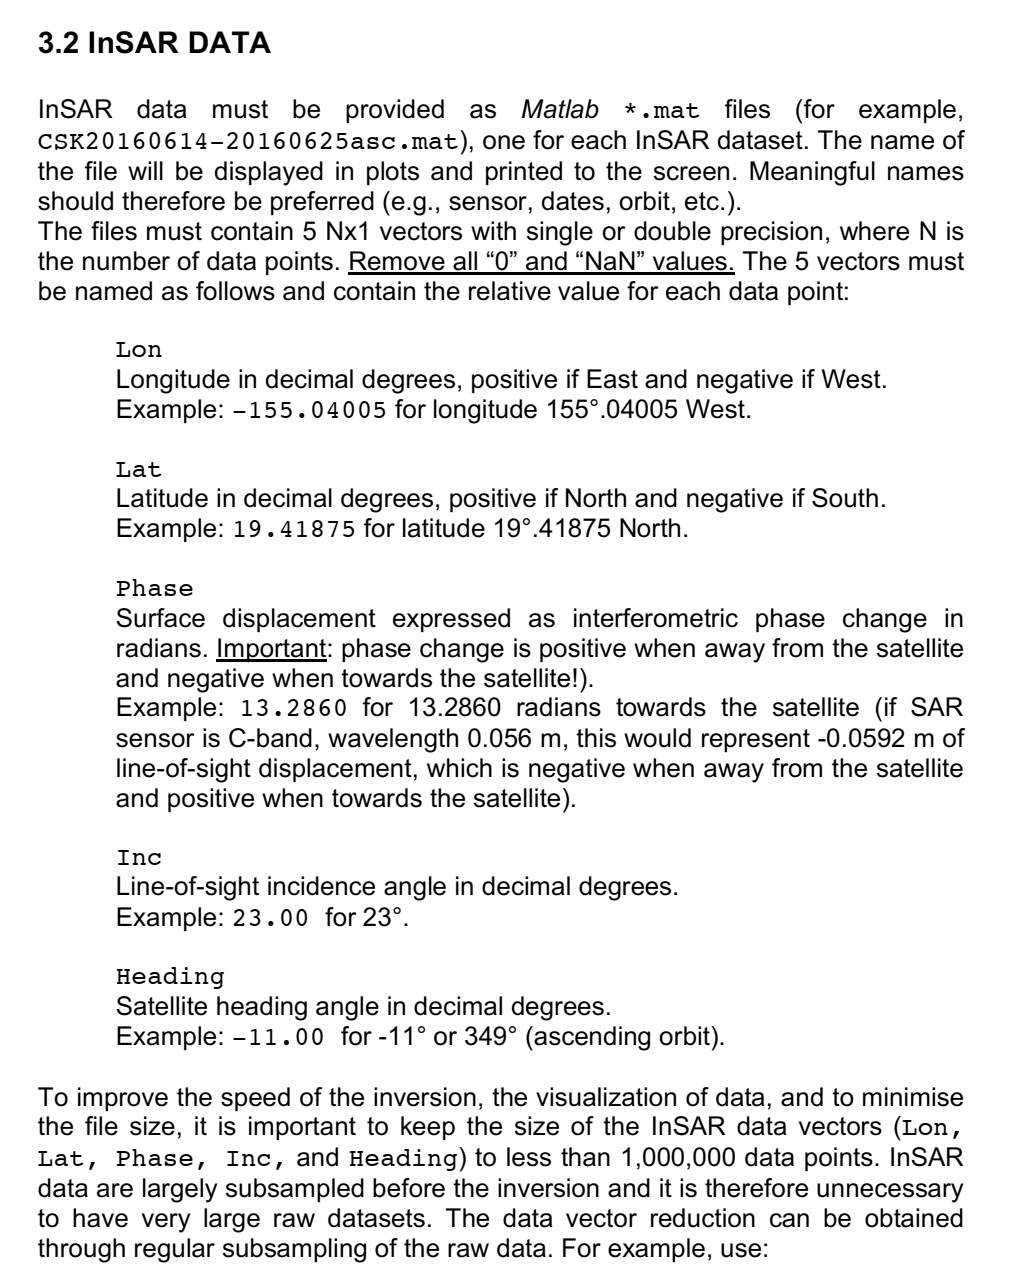
Please tell me the solution for this, Thank you.
Can this stamps-visuallizer be installed and used on Linux? Or is it for Windows? Is it better to open the Stamp exports in QGIS or in visual? Which one is better?
It was developped for Linux but runs on Windows too.
If the App or QGIS is “better” depends on your study and opinion 
@suribabu hi, sorry I am not experienced in GBIS and its data structure. But the export script for the StaMPS-Visualizer is probably a good starting point for you to get the data in a format you need.
Thank you Thho. But In CSV file we are getting only Lat Long and Mean Velocities right.
@suribabu sure, that is right. What I mean is, to use the approach that is used to get the csv as starting point. A first look at the data GBIS requires (from your screenshot) tells me that this information is somewhere in the objects which are generated by StaMPS in Matlab. What you have to do is to find the specific objects and manipulate them in a way that their structure matches your desire. And that is pretty much what I do in the export script.
- I call objects which are made during StaMPS processing.
- I look for specific parts of these objects and take the data I need
- I sort them and bring them to my desired export structure
- Finally I export them
I think this is what you should try and the script might give you some hints in which StaMPS objects valuable data is stored e.g. load ps_plot_v-d.mat or load parms.mat.
2 Likes
Thank you so much Thho. I will do it.
I have installed hese in ubuntu.18 but it does not open for me, Do I need eny other prerequisite softwares for run it?
dear @NAZIL,
please follow the installation steps closely. I recommend doing the installation via renv:
Do you mean that the installation steps were wrong?
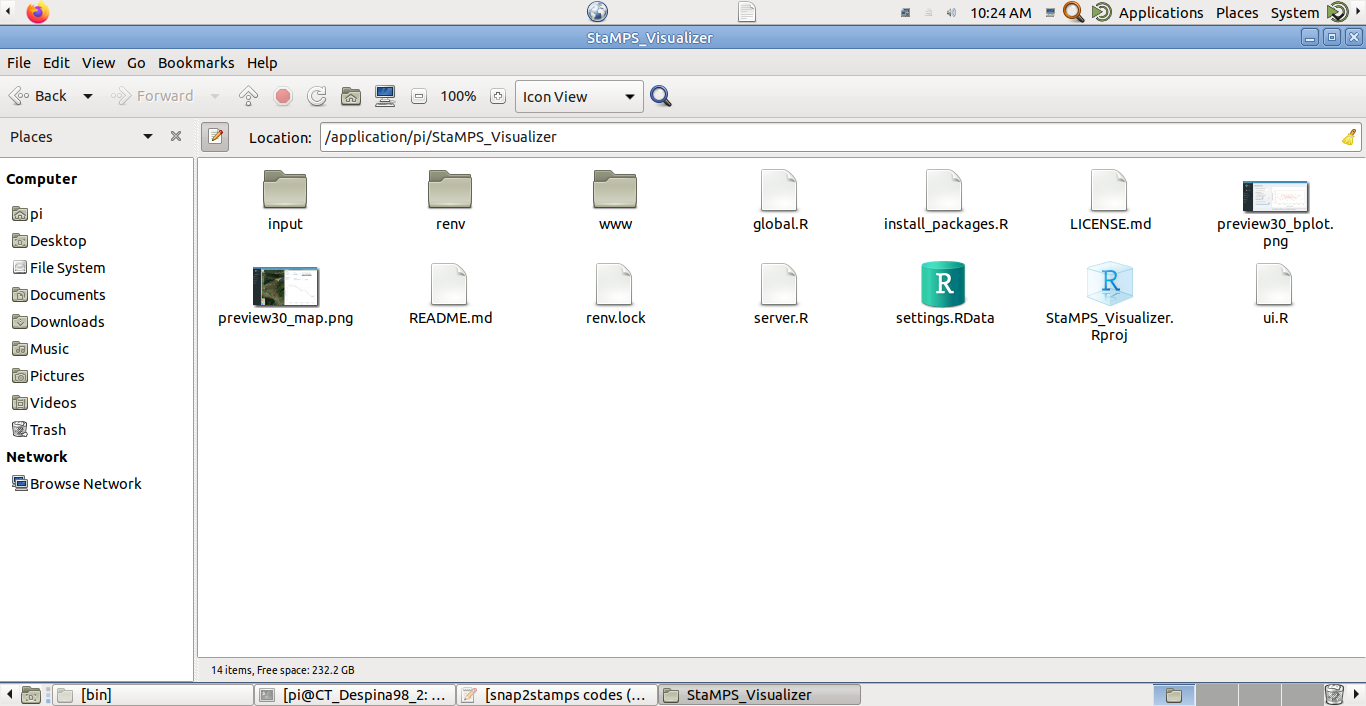
Hi @NAZIL, from your screenshot, I am not sure what type of installation you did, the folder and file structure looks fine to me, but installation does not affect the cloned git repository.
To try if the installation was successful do:
- open Rstudio
- open the StaMPS_Visualizer.Rproj
- go to File --> Open File… and open
ui.R - click on Run App in the upper left panel in the upper right corner
Hi @thho , I followed your instruction, has it been done correctly?but according to what order should I do the next step?
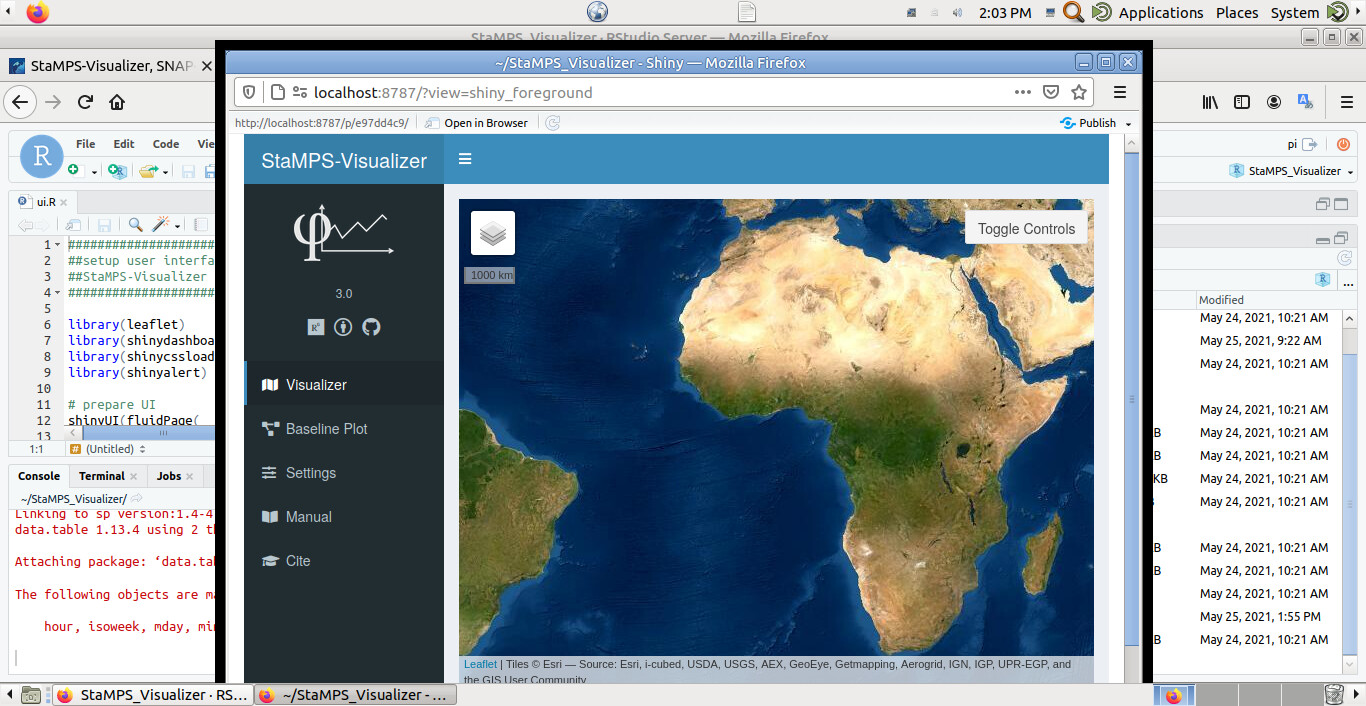
@NAZIL, cool looks good  If you are not familiar with the app, go full screen and explore it a bit. On the upper right you can toggle a panel in which you can select some example study sites and results, go there and “click around” normally the app is more or less self explanatory in the map view…after selecting a study site in the control panel, the map zooms in to the site and you can see the PS points. When you click on one of them the deformation time series is represented and you can do some stuff with it etc.
Then to the left you have some other main windows you can select. Manual will be of interest, there you can find instructions on how to extract and import custom data from your own StaMPS processing to the app. Well the rest is try and error I would say. And in case the app crashes because of some behavior I have not taken into account, give me a note about it and simply restart it
1 Like
many thanks @thho, 
the max number of points is only 50000???
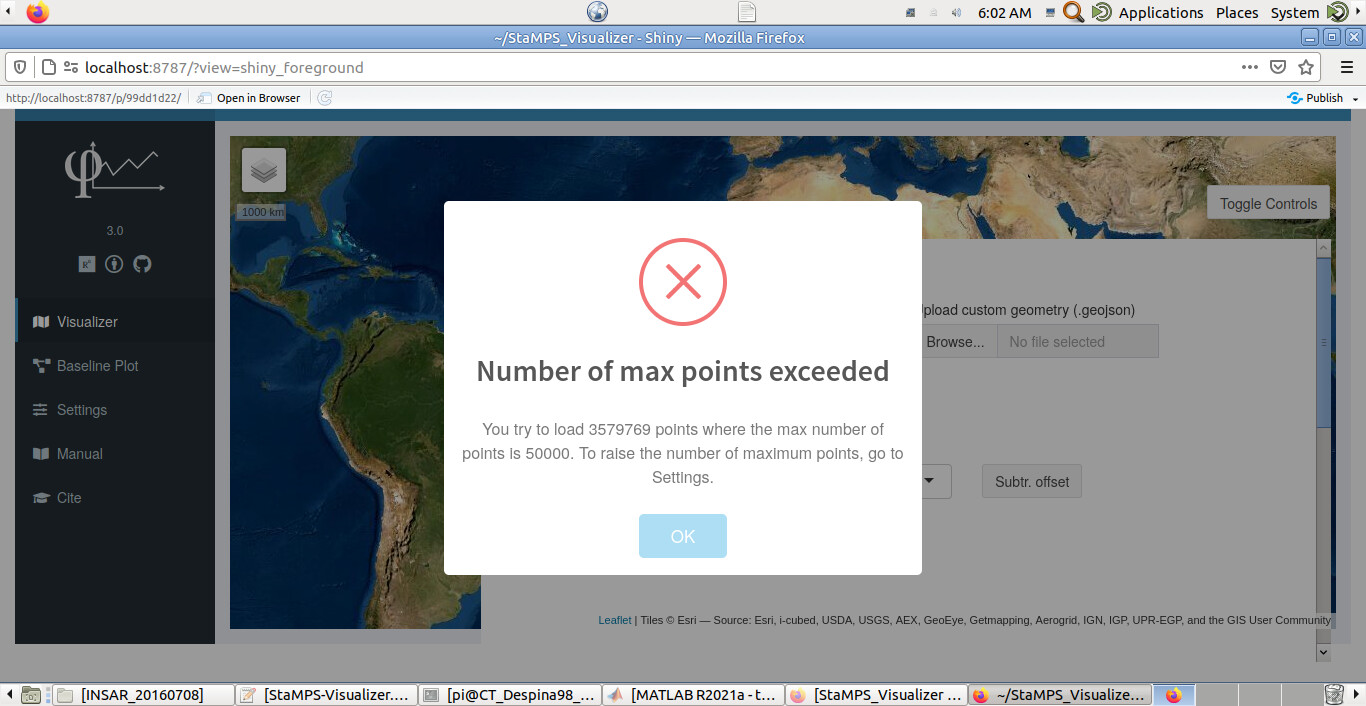
Its more of a warning, and you can change the max number in the settings. Simply go to the Settings tab and play around a bit… But be aware that the underlying functionality of leaflet and its rendering behavior is imo not that performant and more than 50k points might be to much for you system …just saying.However, the Visualizer was built to investigate small scale details, since StaMPS by itself provides OK visualization on larger scales in a more aggregated form… Nevertheless, it is also possible to split your point clouds (exported csv tables) and look at them in several (maybe overlapping) study sites.
In the long run, I might change the entire Visualizer to a plotly dashboard environment which I found would lift this limitation…and is also fun to learn for me
Is this software commercial for high points? Because it did not open when I increased my points to 3 million points.
Hey, the project is what you see in the github repo, licensed under CC by attribution, so no commercial variant. What happens when you try to run the app with an input of 3 Mio points is that it might try to do this but some data loading might take simply too long. As said, the Visualizer is just not meant for this amount of points…I mean in the end it is R with html right and to be honest, that is not the best environment to do things at that scale I think if you really want to visualize 3 Mio points at a time, even a GIS might struggle…have you tried to convert the csv to a shape file of some kind and open it in QGIS? I would be interested in how it behaves.
IF you want to visualize all of your 3Mio points at once, it might be a better idea to:
- get the raster grid of your prime image
- rasterize the point values of the velocity to this grid
- visualize that grid, which would be an complete different problem for your computer instead of 3Mio vertices
with some effort, it would also be possible to link grid cell number of a grid created like that to a databse with the time profile of the deformation…but well you have to programm it
1 Like
How can I do it?convert the csv to a shape file for QGIS?