I am not entirely sure if the script is still working with the export, but with some testing you should get it working
Considering that the aim of my thesis is to obtain the annual rate of subsidence in a plain, what are my next steps after creating a CSV file and transferring it to Q software? Will you guide me please?how can I create mean LOS velocity , velocity ,unwrappphase and wrapphase maps and Time series graphs,baseline graph of datas,
Hi @NAZIL, I am not entirely sure, it depends on your study site, exact research question etc. also I have not done it with QGIS and I can just provide technical information and about the Visualizer app, helping with details concerning specific study sites is beyond what I can offer, sry. But when you go back in this thread, you will also find some discussion about how to get the data into QGIS by using the right tools, to visualize the time series plot.
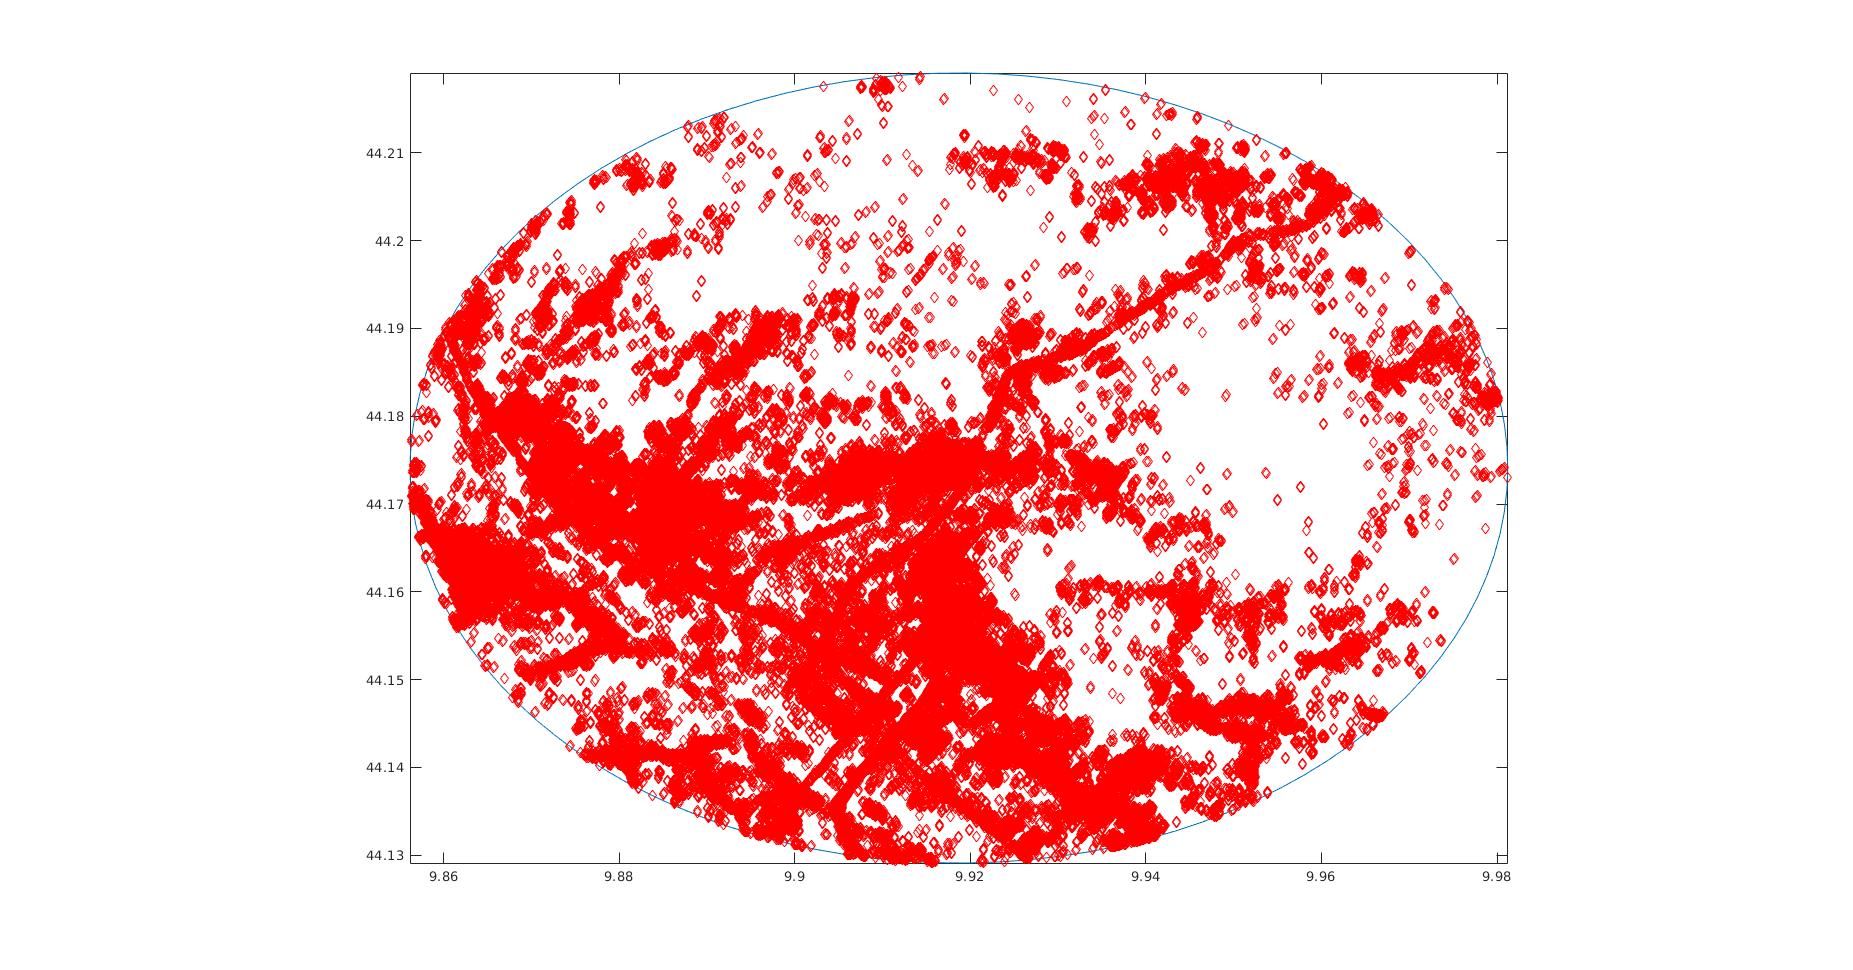
Hi @thho, so, how can reduce the number of input points, and dividing them into more groups (due to the default software provides a maximum of 50000 points?)How can I capture only the points within the shape file of my case area? Wouldn’t the results be compromised by reducing the accuracy points?
Hello, I did the analysis of my study area in Stamps with 3 patch, I had no problem until exporting it to a csv file.
As you can see in the images, I am able to generate the selection of my reference point.
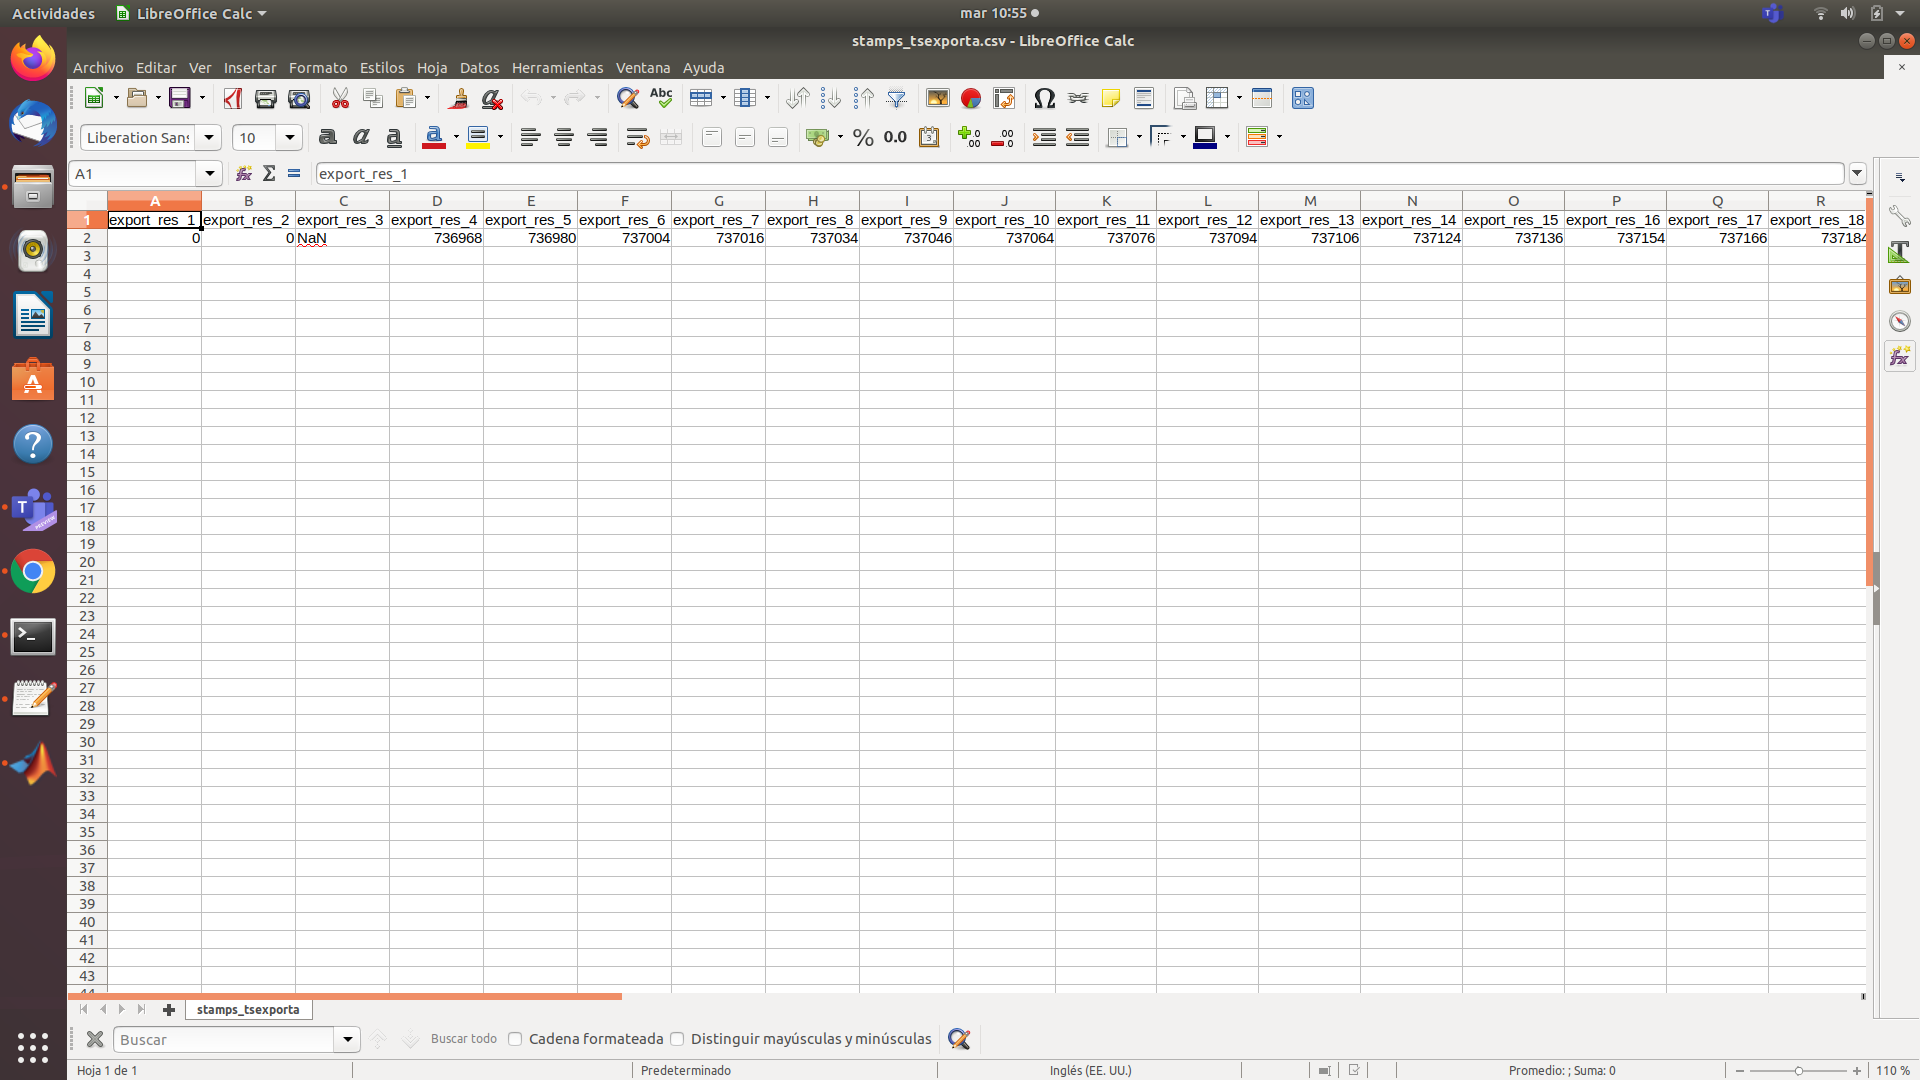
However, the csv file that is generated does not contain information
What could be happening to me?
in fact. I Can be able exported as a kml file
Hi, can you provide a screenshot of the export code you use, and also the version of StaMPS and The Visualizer.
You should use:
- StaMPS version 4.x
- export code for StaMPS version 4.x
- StaMPS-Visualizer version 3.0
load parms.mat;
the ‘v-doa’ parameter is an example you can change it to your needs
% but be sure that you use the same paramters as above in the ps_plot()!
ps_plot(‘v-do’, -1);
load ps_plot_v-do.mat;
lon2_str = cellstr(num2str(lon2));
lat2_str = cellstr(num2str(lat2));
lonlat2_str = strcat(lon2_str, lat2_str);
lonlat_str = strcat(cellstr(num2str(lonlat(:,1))), cellstr(num2str(lonlat(:,2))));
ind = ismember(lonlat_str, lonlat2_str);
disp = ph_disp(ind);
disp_ts = ph_mm(ind,:);
export_res = [lonlat(ind,1) lonlat(ind,2) disp disp_ts];
metarow = [ref_centre_lonlat NaN transpose(day)-1];
k = 0;
export_res = [export_res(1:k,:); metarow; export_res(k+1:end,:)];
export_res = table(export_res);
% you can specify the location and name of the .csv export by renaming the second parameter
writetable(export_res,‘stamps_tsexporta.csv’)
Ok, that looks fine to me! However, it is important, that before you execute this lines, you have to first call the ps_plot('v-do', 'ts') and select an radius which points are included. If you do not do this, this can result in an empty csv file, so this can be your problem.
Yes.
In fact these captures show that I did this step, selecting a radius of 5000, I thought it was big enough (in fact I think you can see in the image all the points that are obtained from that radius) maybe I should increase the radius even more ? maybe 50000?
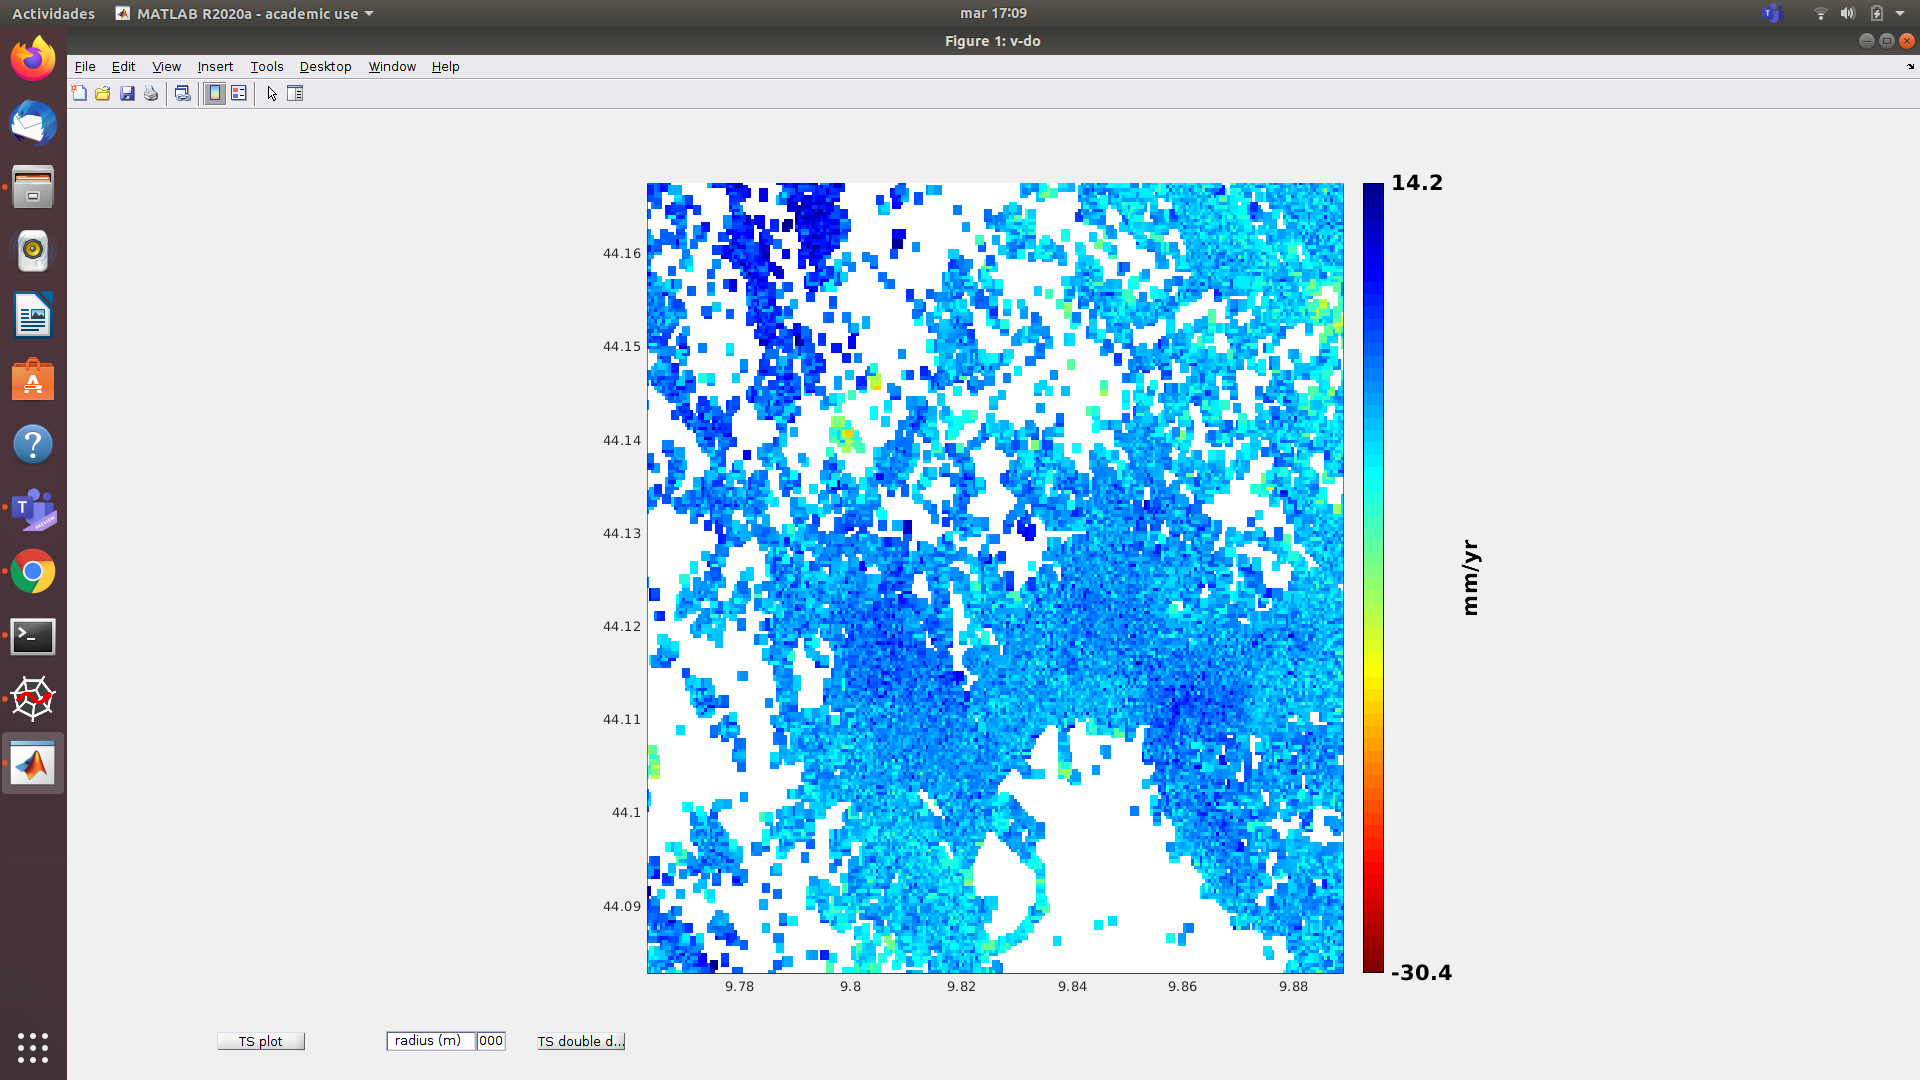
hi @thho, @ABraun, I was finally able to reduce the number of candidate points and open it inside Visual Stamps. My question is, are the values not the same?and What is it like to continue working?
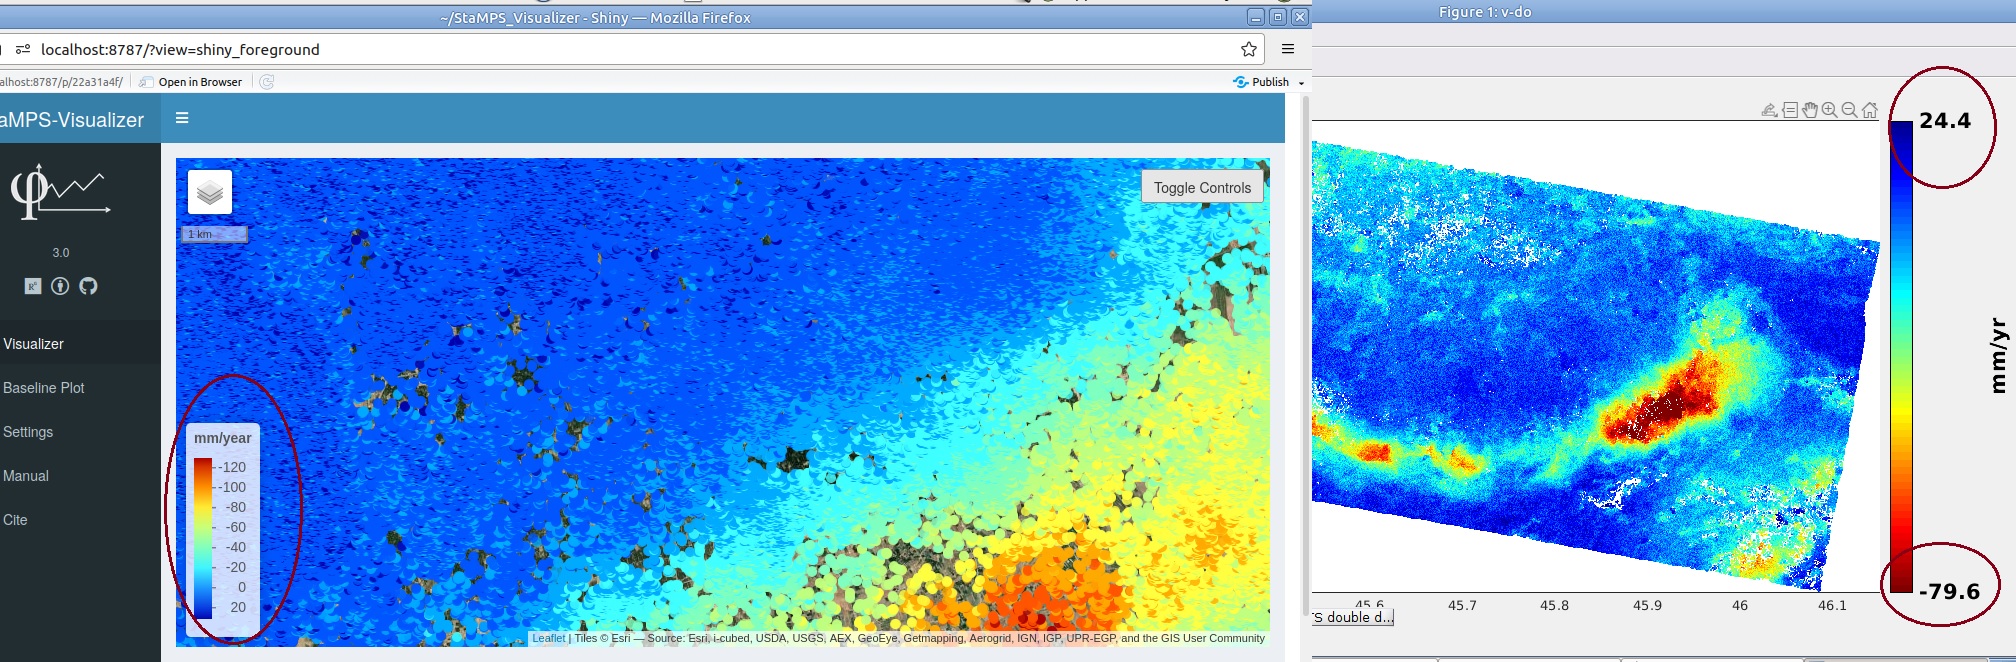
Hi @despina98, good work, one thing I would do is to select a smaller point size in the visualizer to make the points not overlap and to see more of the background aka spatial context.
Concerning your question of the values: First, the Visualizer color ramp is upside down, relative to the one in Matlab but this is fine. The 24.4 value is roughly the same in the Visualizer color ramp so no problem here, the -120 is simply an outlier. StaMPS in Matlab suppresses outliers in the visualization, the Visualizer does not, hence it appears as value and the color ramp has another stretch.
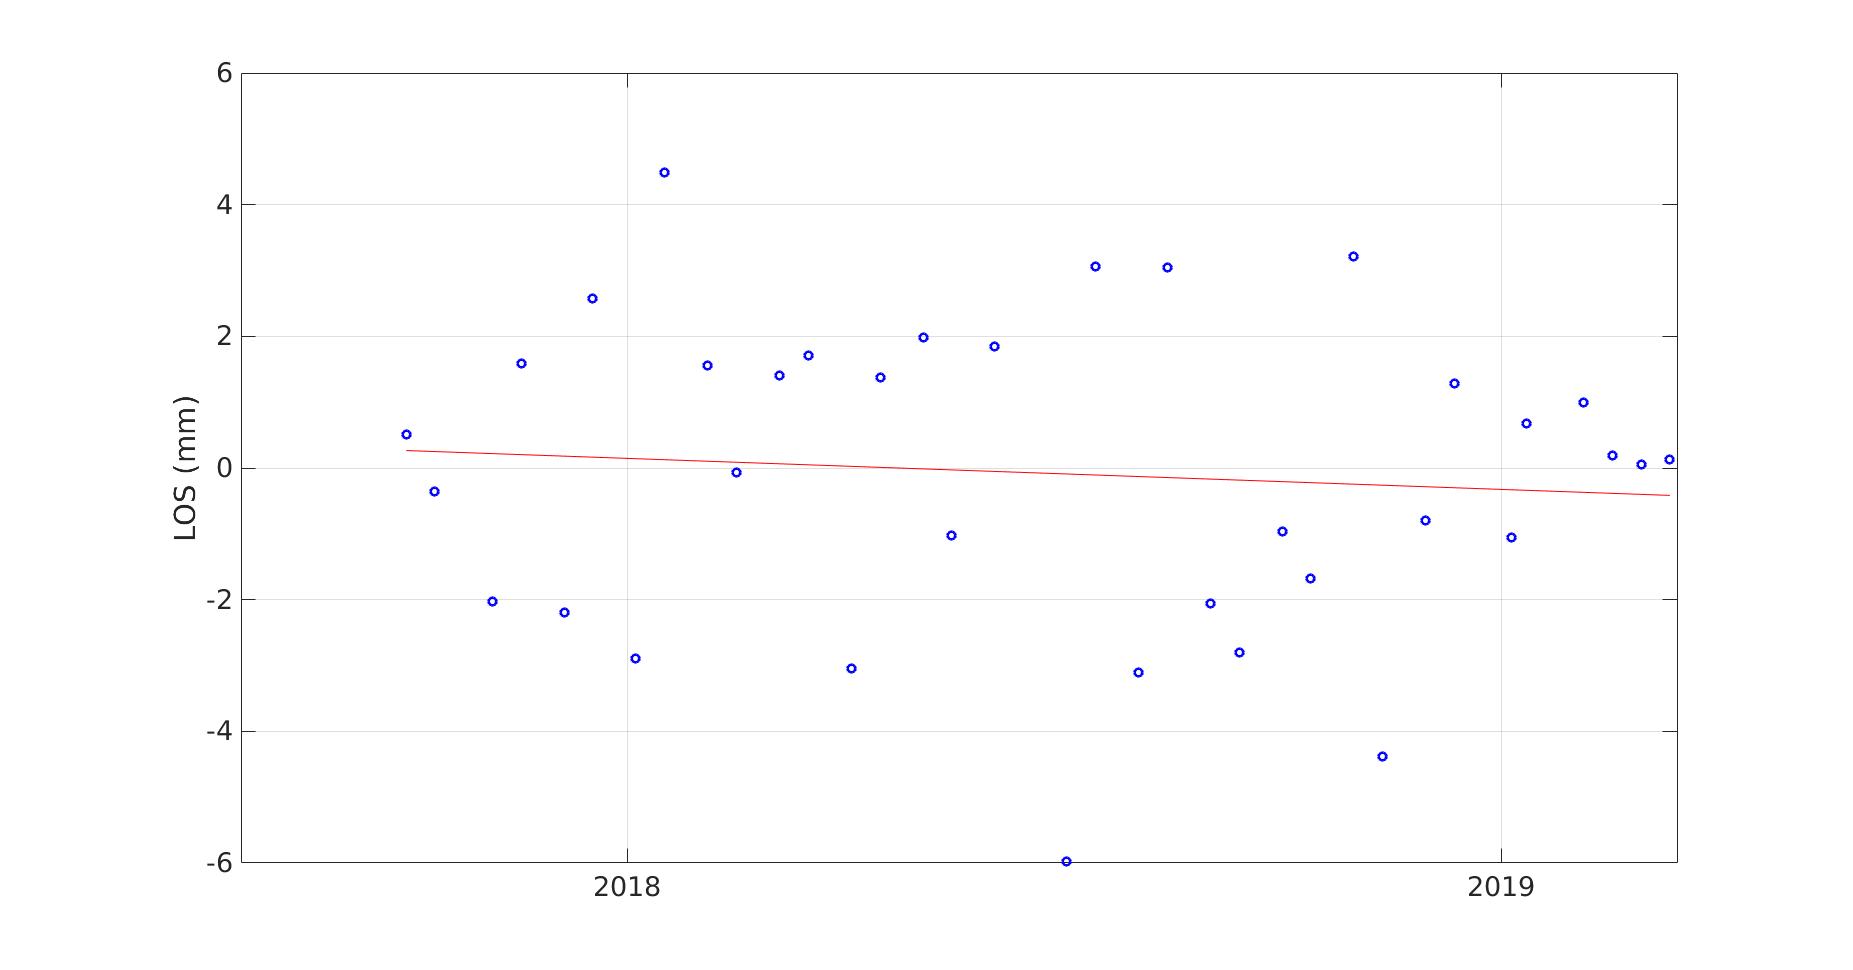
The next steps depend on your research. I personally use the Visulaizer to check for thematic context with the StaMPS results…like, is there a construction, a land slide or steppe slope, something that helps you to discuss the patterns of displacement. When you toggle the upper right panel, you will see a trend line for each point you click on, therewith you can also see the exact temporal development instead of just the deformation velocity, which can be very oblique.
1 Like
I did not understand. That is, the visualizer estimates the value more than the actual value?Which of the two is the actual value now?
I also want to use Visualizer to check the thematic context with StaMPS results. like subsidence 
The point is that the tools might set a different range for the colors, independently from the actual values. Many programs (also SNAP) do not distribute the colors over the full value range because outliers lead to less contrast.
So the values in the legend do not necessarily represent the absolute minimum and maximum.
1 Like
Hi,
I’ve just recently dipped my curiosity with PS-InSAR as I did this as a final project in one of my RS courses. Just want to share the web app I’ve created based on Python, this is heavily inspired by the SNAP-StAMPS visualizer based on R. The code can be accessed thru Github. You can explore the web app via a browser here, SNAP-StAMPS Visualizer Web App. Hope this helps someone in some ways. Any suggestions on how to improve this app are very much welcome.
4 Likes
@kaquisado very nice implementation 
1 Like
Thank you @thho! 
hi everyone , i have a problm.
I have a problem Error in navbarPage(“StaMPS/MTI-Visualizer 0.1 (Beta)”, id = “nav”, tabPanel(“TS explorer”, : no exist e"navbarPage" such function
please help me.thank you
Hi @thho
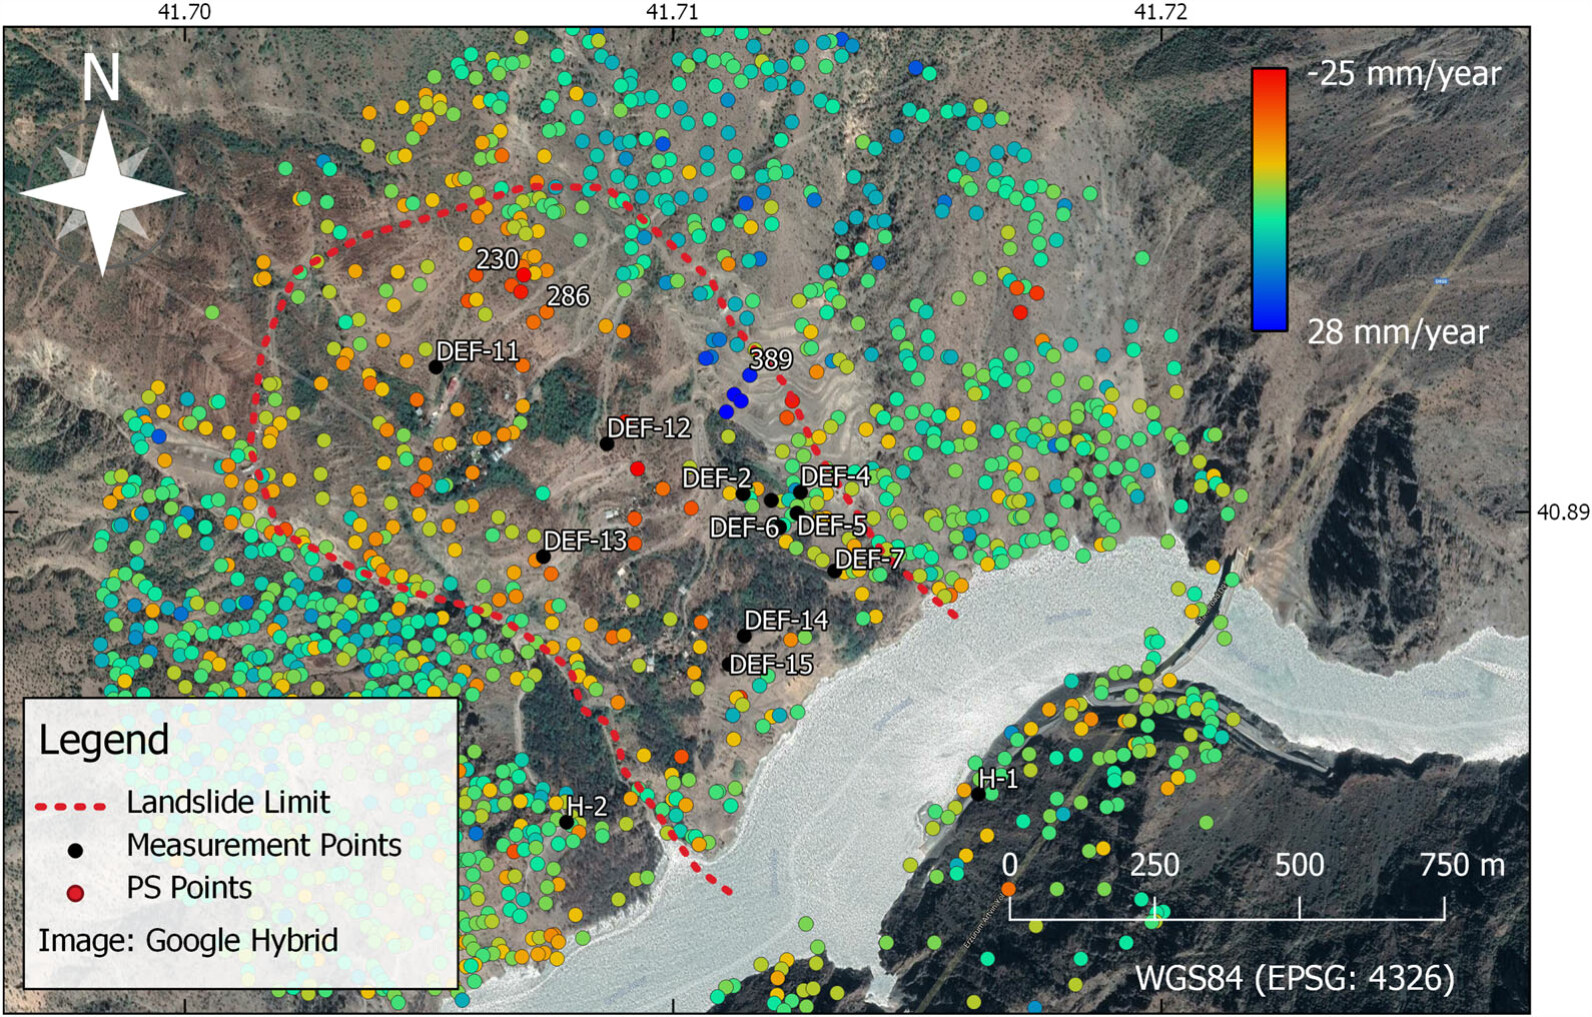
How can I get my output in stamps_visulizer?Such as map legend, reference area, north arrow and …Histograms based on the annual average LOS velocities (in mm/year) of ps points?Like this map that attached.
HI @luo most probably, there are some packages missing in your installation, how did you install the Visualizer? Here is the install guide if you want to look it up:
Hi @despina98
- you need to do the export from StaMPS as explained in the Visualizer’s Manual
- the csv table has to be moved to the folder structure of the Visualizer, this is also explained in the Manual
- to add geometries to the map, you can use control panel there is menu “upload custom geometry” you can upload .geojson files
- map legend is just aligend with the points you upload, changing it is possible in the server.R script checkout line 69 and the following
- scale bar is on the upper left
- i am not sure what you mean by histograms, a velocity vs time plot for each point is triggered when you select a point by clicking it and the control panel is open (button upper right corner)
- north arrow can probably be placed with a leaflet function or something in combination check
https://stackoverflow.com/questions/22325460/how-can-i-add-a-north-arrow-to-a-leaflet-js-map
or
https://mhallwor.github.io/_pages/MakingMaps
or
https://stackoverflow.com/questions/50452750/r-leaflet-plot-ship-direction