Dear ABraun,
I want to know how to use time series in QGIS to analyze a single point of time series trend, can you provide information about the QGIS time series plugin
Dear thho,
I would like to ask you some experience on how to use renv, because I searched the website for a long time and did not find a tutorial on how to use renv (including installation)
Please see here:
Thank you,I imported it to arcgis and then export as shp file,and then I can use the time series plugin successfully 
@xwguo Please read the README.md of the repositories you are using. Its all there:
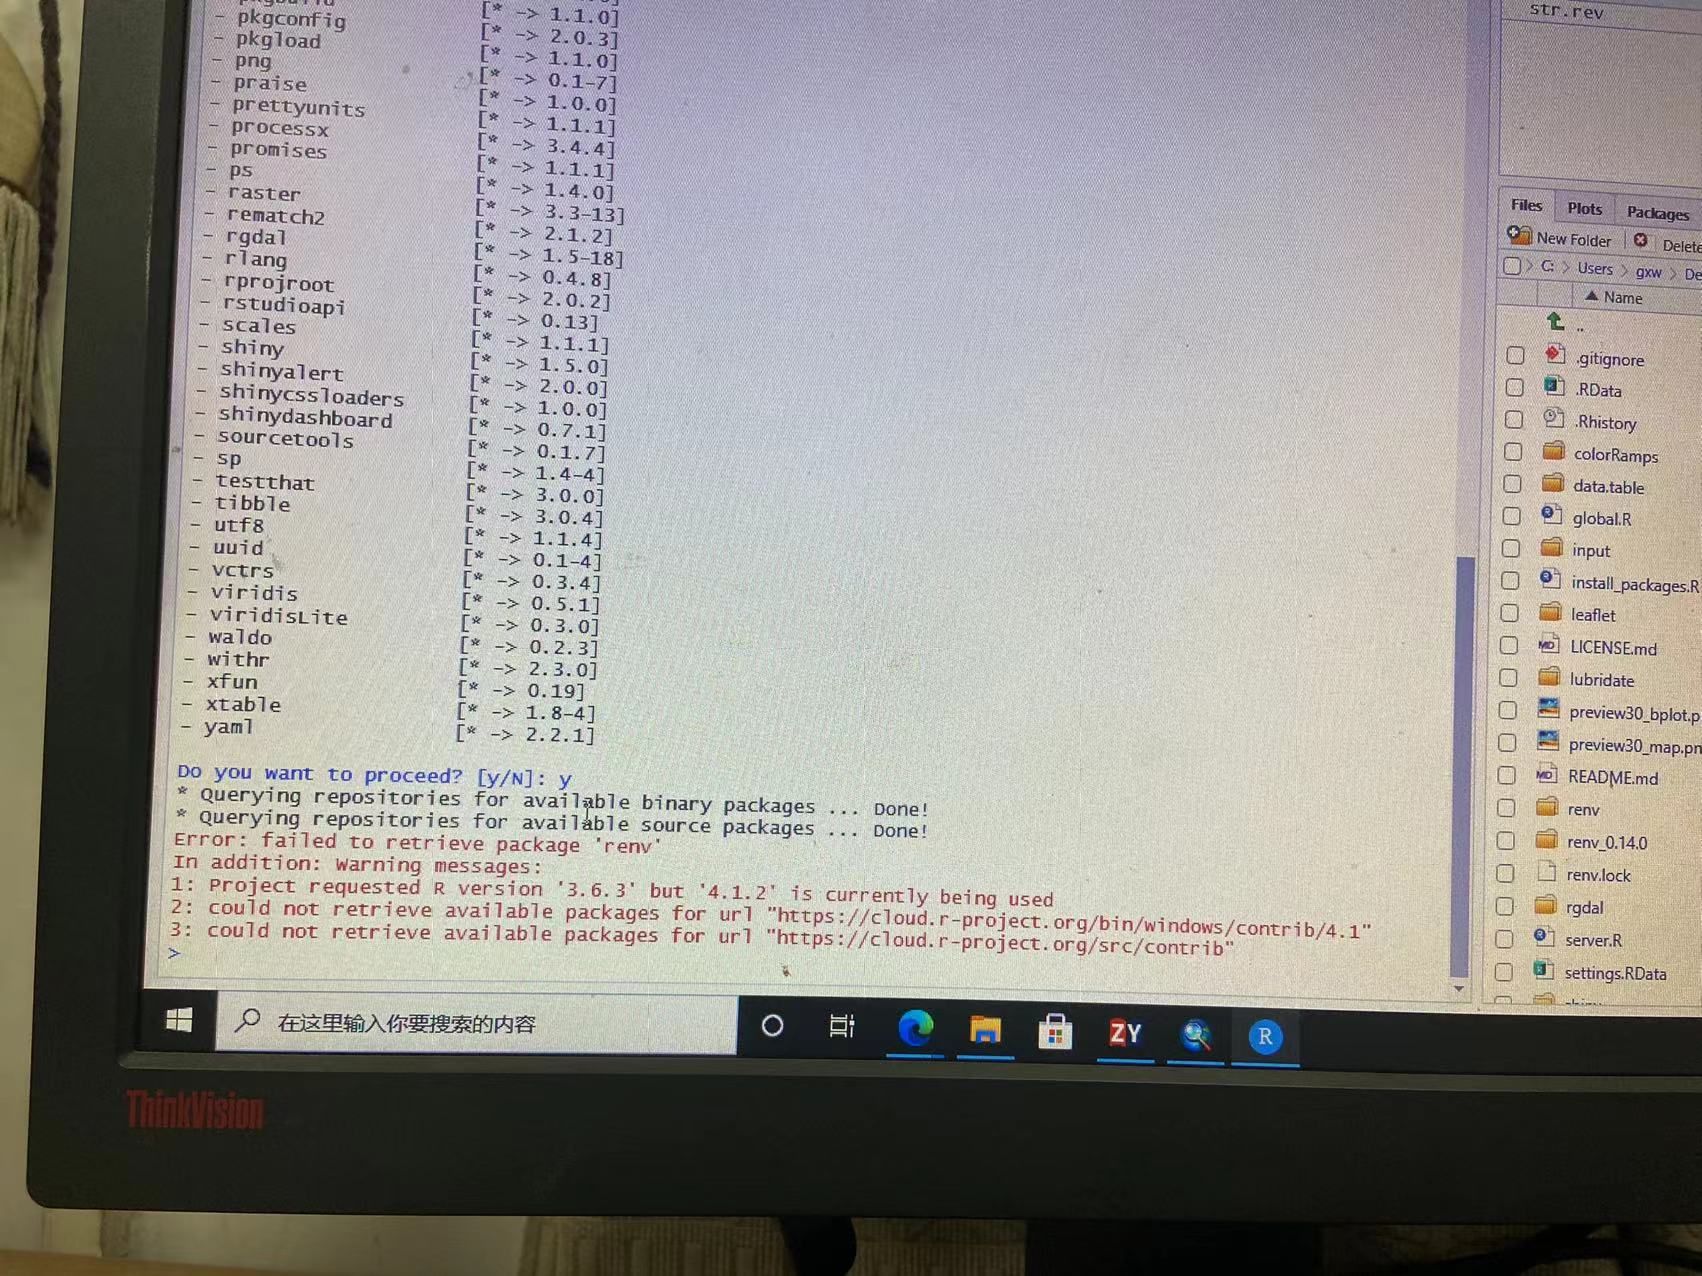
It seems that my version of R have some problems,but I don’t know how to solve it,can you give me some advice

@xwguo thanks for the report, I will care about it asap. Until then, you can downgrade to 3.6.3 manually, or use a dockerized version of R v3.6.3 where you built the renv environment
OK,I will try it later
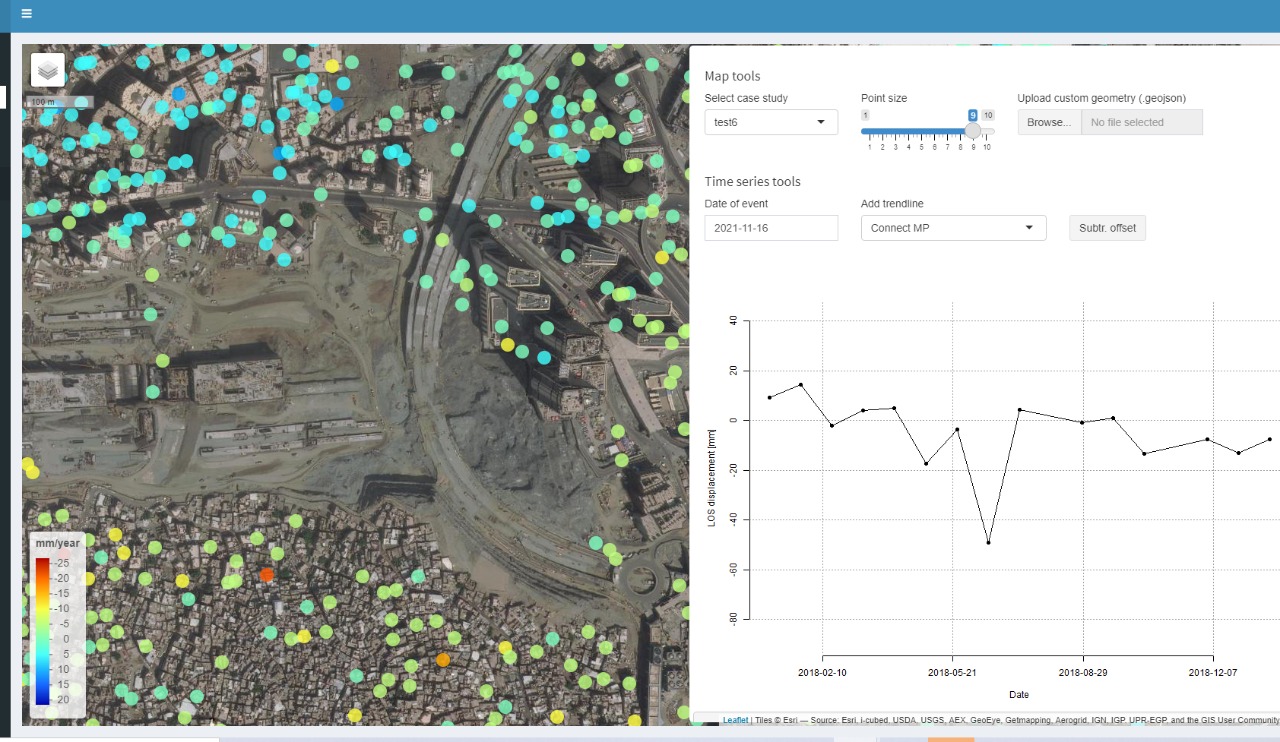
Hello, i am succesfully process stamps. but now i have an issue which the map background on the stamps visualizer not appear. how to solve it?
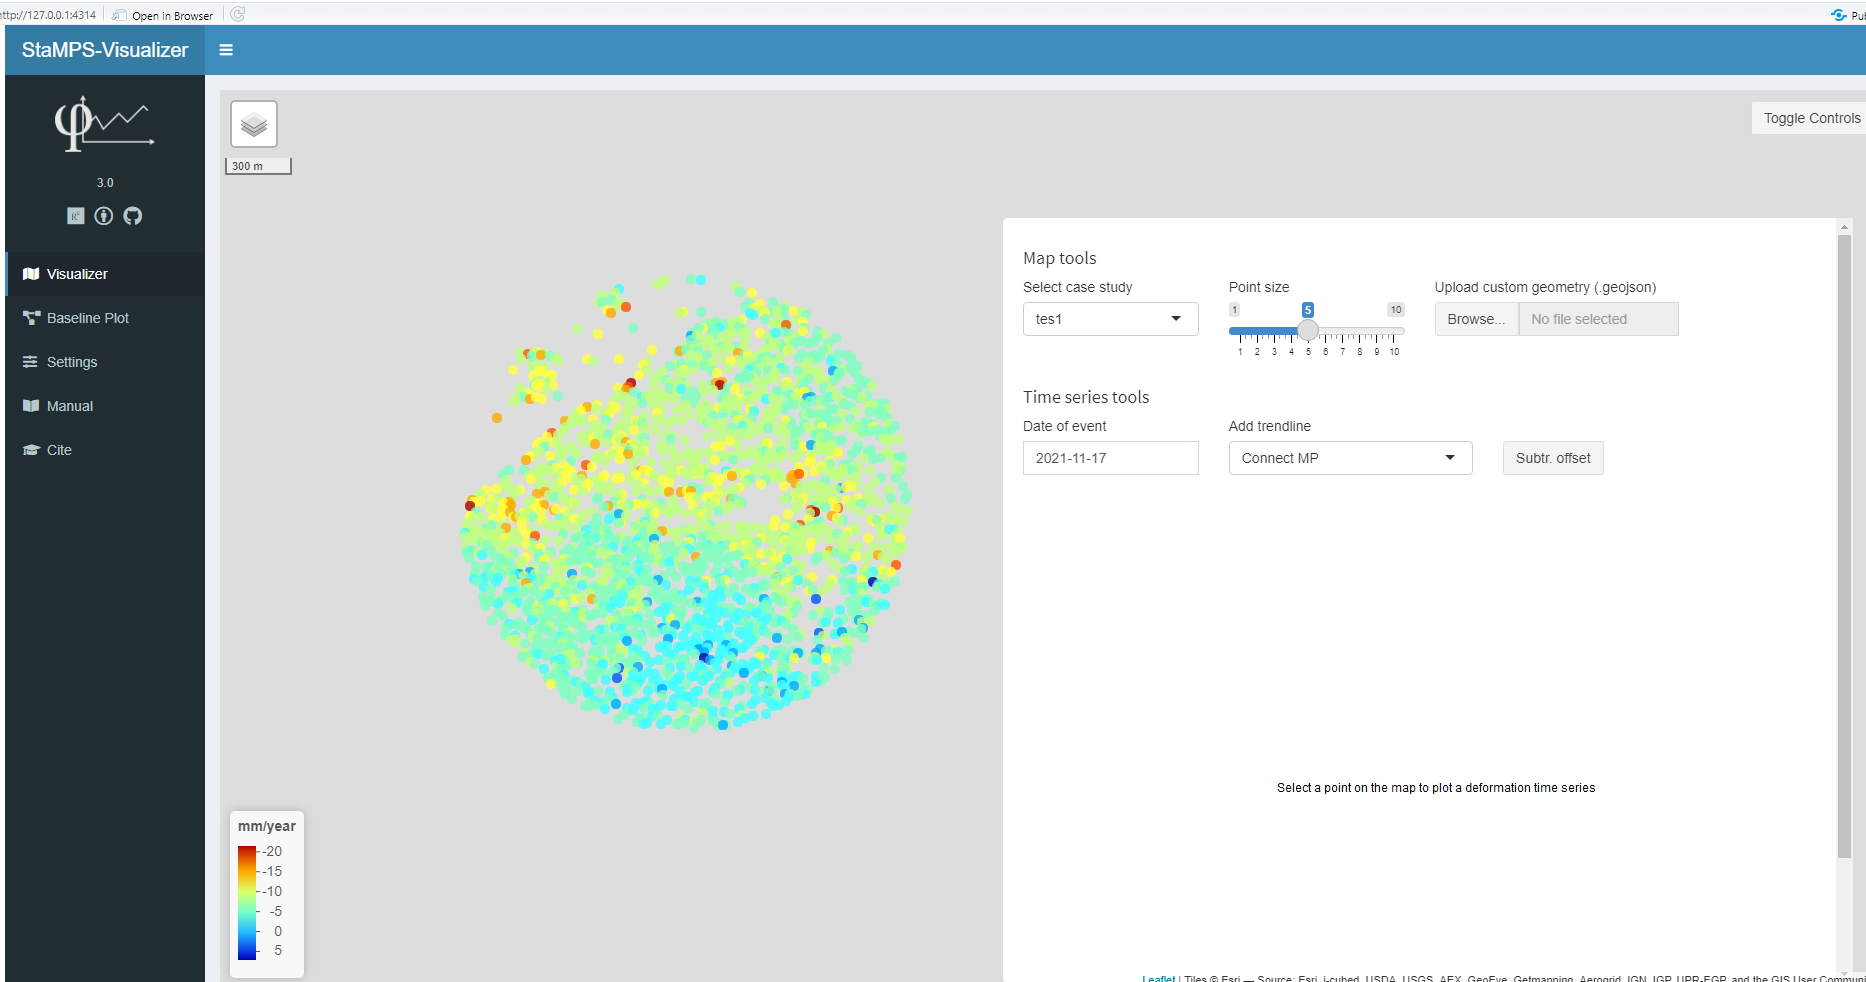
Hi @asepMH, good work so far! There are some options that were figured out here in the thread concerning this problem. Since the thread is pretty messy I will summarize them even, when some are super obvious 
- You are not connected to the internet, but you need in order to use the WMS of ESRI or OSM
- You zoomed to close, at some very very close zoom level, some WMS provider tiles switch to be gray
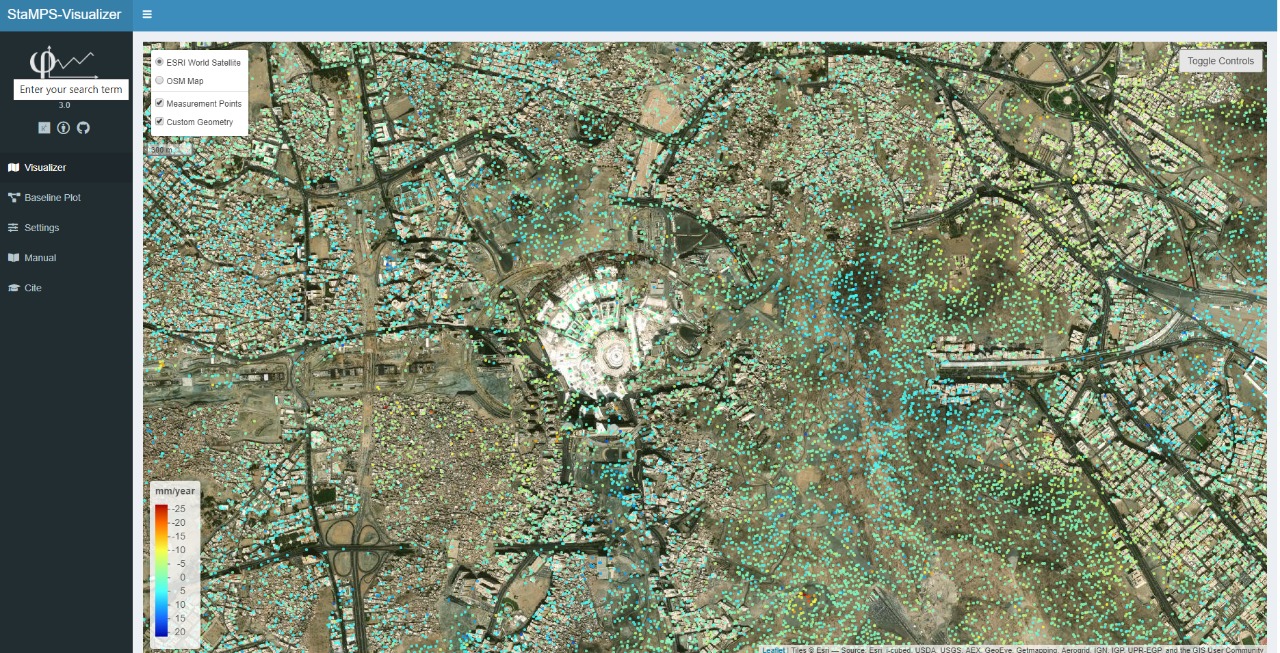
- Your IP is blocked by the provider (mostly ESRI since US company), check this: switch to OSM basemap (upper left corner of the map canvas has the layer button, where you can switch the basemap). If OSM basemap works, most probably is that ESRI is blocking your IP, if I am right they do this upon your region code, that behavior was reported for a user from Iran. To solve this, you can use a VPN.
A more sophisticated some kind of solution, is to choose an other WMS, to include your a WMS different from ESRI satellite or OSM you have to change some lines in the server.R script look here:
Hello everyone, I want to know if the deformation rate obtained by the last stamps is the true value of the LOS direction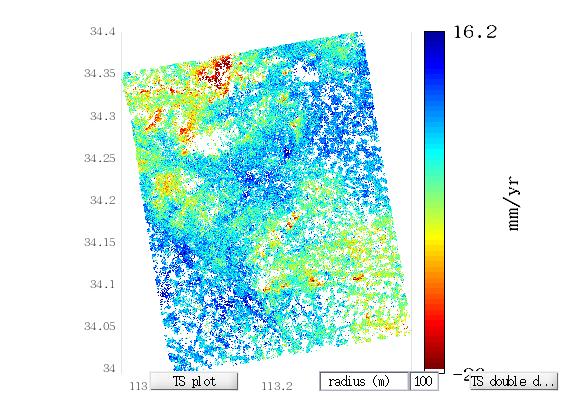
Thanks a lot @thho for your answer. Now this problem was solved after using Vpn. .
Btw this stamps visuaizer is very nice application, great @thho 
2 Likes
@asepMH cool  nice to hear that you like it!
Can this software export pictures, such as ‘png’ format.
hi @dream81 nope, not yet, if you can say which plots and views you want to export I can see if I can include it in the next update.
If you just need a record of the plot, screenshots may be enough, but if you may need to publish a plot, packages like Matlab, Python matplotlib, R, and Microsoft Excel have put a lot of effort into publication quality plotting, so it is nice when programs have the capability to export the data used in a plot. I assume data export is a relatively simple addition to existing tools, while the ability to match the publication quality possible with existing general-purpose packages would take much more effort.
exactly. tbh, the export of the data to be plotted is more or less there. Since the csv table itself is the raw data and if you need e.g. the number of the measurement point, this is also given in the plot view of the ts plot in the visualizer. However, if there are specific plots or data which people want to export, I can see what I can do 
1 Like
Well, thank you for your reply.
Ok, thanks a lot.
hi @ABraun ,How do I open the PS Time series viewer plugin in QGIS? Where is it located?