Please check here:
https://forum.step.esa.int/t/re-workflow-between-snap-and-stamps/25035/2?u=mdelgado
Hello!
I have a question to @ABraun, @mdelgado, @thho.
For StaMPS PSI analysis, is there a minimum area (say in sq.km) that should be defined through the BBOX project config file in snap2stamps?
I am wondering if it’s possible to define a small AOI (say equal to or less than 2 sq.km).
Thank you.
Dear @ryeramirez,
Normally for coregistration of products you need at least 1 burst (but the snap2stamps version still needs 2 burst minimum to work smoothly).
Later, during the subsetting using the BBOX values, if your area is too small, it may happen that the PSI would cover only an area in which pixels are all subsiding or uplifting. You need to be sure that a stable area (or a reference area/point) falls inside.
Normally, the analysis covers several sq km, not only 2 (sqrt(2)x sqrt(2)), but at least an area big enough to differentiate stable/deforming areas.
I normally work with larger areas, not 2 sq. km, maybe 10km x 10km?
What about you? @ABraun, @thho ? What do you think about it?
For some of the areas I have investigated already, the area I used was larger than 2 sq.km (larger than 15 sq.km actually) for the same reason you’ve mentioned, and to make sure that I have enough PS (initial PS selected) prior to Step 1 in StaMPS.
But for landslide analysis, I am concern about the tendency of still detecting few PS even if I have large area defined and say used an ADI a bit greater than 0.42 (say because the whole area is really mostly covered with vegetation). If few PS were detected and these PS are quite far from each other, I am a bit worried that the connections or networks between these points used for some sort of integration/interpolation? will be ‘weak’ so as to say. But if we can ‘concentrate’ or ‘focus’ the selected PS in a smaller area (with a sure stable subarea), then I am thinking that the estimation would be improved. Sorry to say that I am not yet very familiar on how the whole StaMPS algorithm works.
I hope you get my point.
Hi,how can u plot baseline like yours in psINSAR?Can you teach me?
Hi, @yzxtll!
If I am not mistaken, this graph was automatically generated using the Matlab-based InSAR tool called SARPROZ.
In my case, I just use MS Excel to plot such graph.
I agree. Once you have all images in one coregistered stack, you can open the InSAR stack tool and export the list of images including their respective perpendicular and temporal baseline.
That image is from a scientific article, however it can be built in matlab o en Excel.
Thank you so much mdelgado . It’s working from me.
1 Like
Could you tell me how to add path,Please!
actually, to modify and run the StaMPS_CONFIG script before processing should do the job. Make sure that you add all paths correctly. Instructions are given here (especially point 2.2): https://gitlab.com/Rexthor/gis-blog/-/blob/master/StaMPS/1_stamps_setup.md
1 Like
If you install all the software in root (using sudo), i think no need to add any path in Stamps_config.bash.
only thing i added in .bashrc file stamps/bin like below
open .bashrc file in root
export PATH=path of stamps upto bin (/home/username/stamps/bin):$PATH
then run
source .bashrc
And then run mt_prep_snap in any path, if it comes then are ready to use Stamps.
Thank you so much ABraun. This is solving the recent error of mine.
actually, the mt_prep_snap command is no longer needed since StaMPS 4.1 but I’m glad it solved the error.
1 Like
Thank you very much. My problem has been solved and your suggestions are very useful.
1 Like
Hello one question.
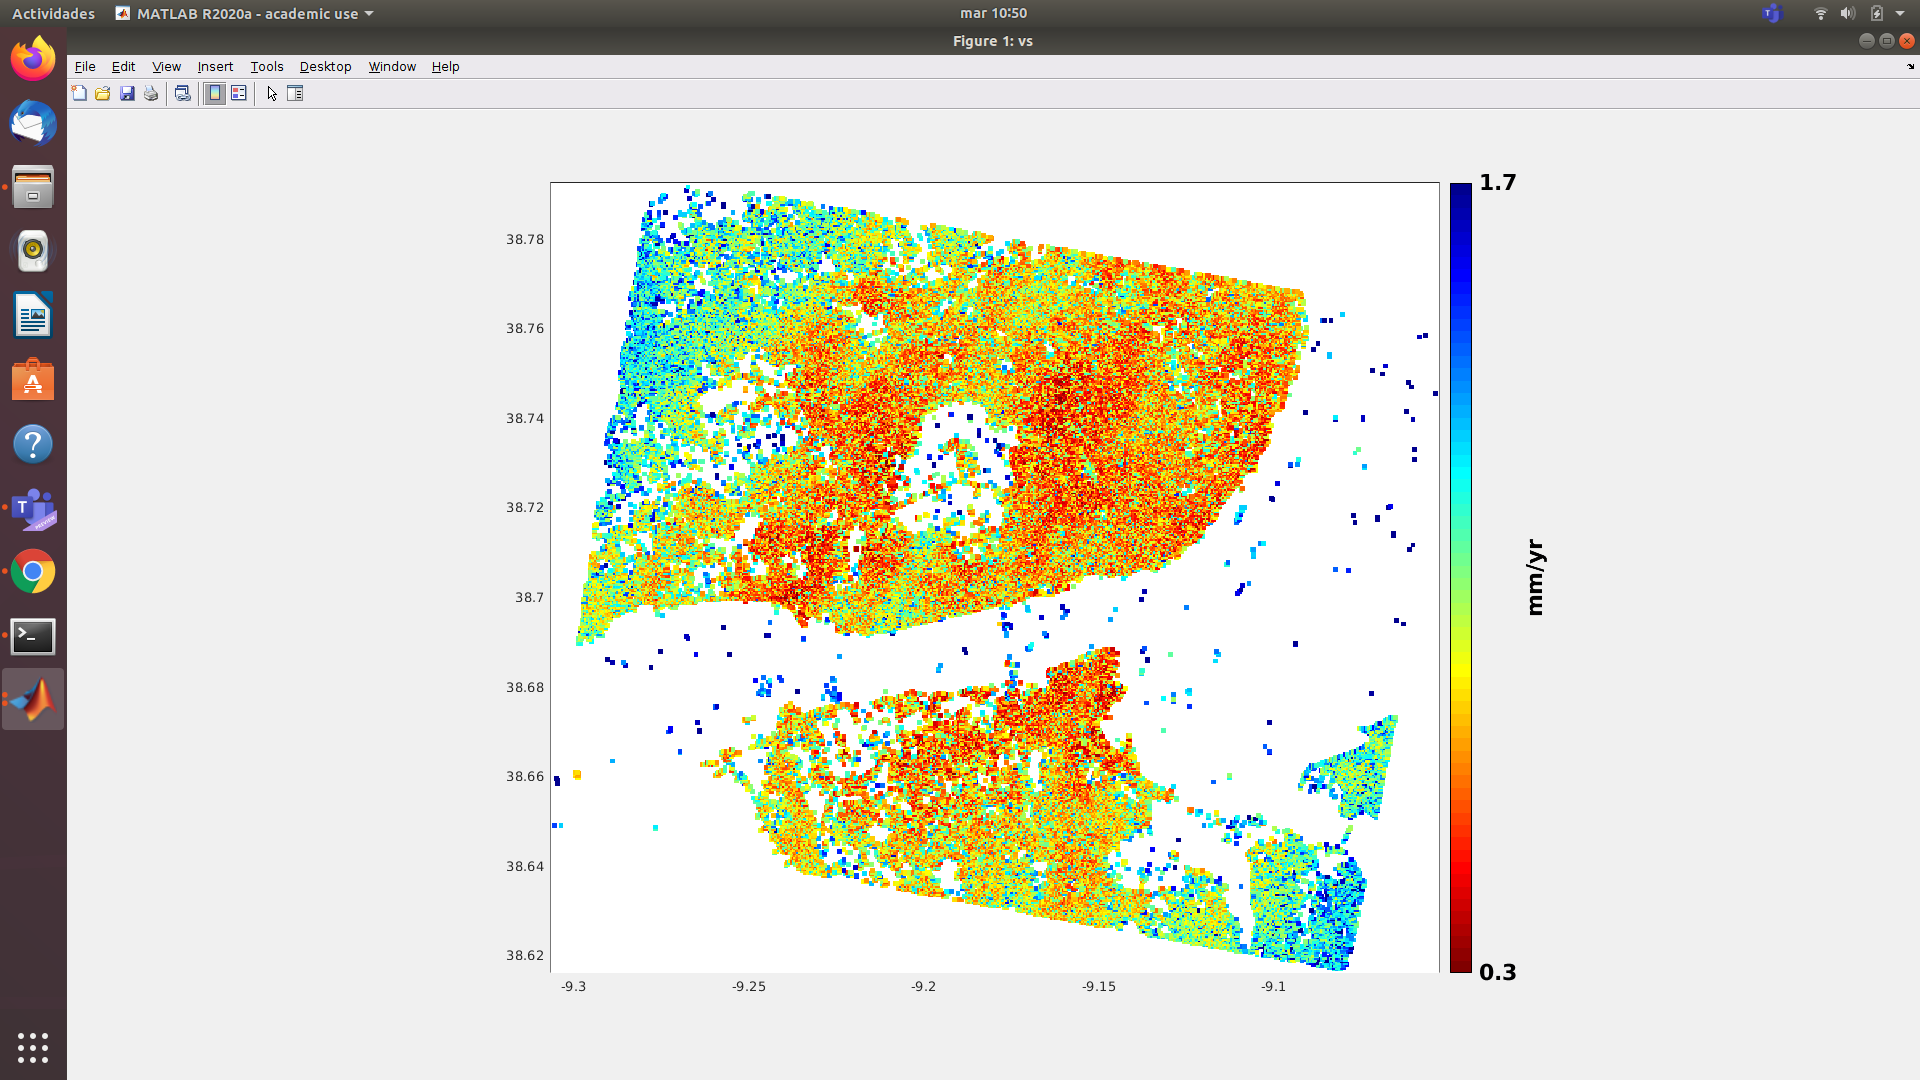
I have done an analysis with Stamps and after months I would like to reopen the whole process again (step stamps (8,8) already completed in the past), to be able to generate a series of commands (basically ps_plot ( ‘vs’) among others) not made by me even ignorance of the technique; However, I am not clear if a file can be directly loaded (I don’t know which of all those generated) or on the contrary, I should repeat all the analysis from stamps (1,1) again.
Therefore my question is how do I load in matlab a past job with the final results stamps (8.8) so as not to have to repeat the entire analysis process, thank you very much for the answers.
source the config file again in the command line, then navigate to the working directory where the files are processed and start matlab again.
You should get all parameters when you enter getparm and be able to continue working with the data.
Thank you so much ABraun.
Is it possible to convert it into a csv file to be able to identify which pixels have the highest standard deviation?
Maybe something similar to what is used to export to StaMPS-Visualizer? 
I’m only aware of the CSV export of the StaMPS visualizer you mentioned.
Hundreds of topics in a thread is probably too much - specially for something that started in 2016 - I am sure that people have an hard time reading and finding something useful in this.
Maybe we should lock this thread (and the StaMPS-Visualizer, SNAP-StaMPS Workflow and ask people to create new ones for specific questions.
Perhaps we can create a pinned thread with pointers to pertinent topics within these two that may be relevant.