I tried again and am still not getting any results. So I will share the steps I undertook with two ALOS PALSAR QuadPol scenes so we can maybe together find out how to proceed:
I followed these tutorials and documents:
-
http://eoscience.esa.int/landtraining2017/files/materials/D5P1a_P.pdf
(great course materials of Laurent Ferro-Famil and Eric Pottier) -
http://seom.esa.int/polarimetrycourse2015/files/6_PolTomSAR_Practical_PolinSAR.pdf
(similar but different use case by Laurent Ferro-Famil, Stefano Tebaldini and Eric Pottier) -
https://earth.esa.int/documents/653194/656796/PCT_Training_Course_v2.pdf
(helps to understand the theory behind it) -
http://www.disp.uniroma2.it/geoinformation/students/geoinformation-dissertations/polarimetric-SAR-interferometry.pdf
(fantastic PhD thesis with detailled explanations)
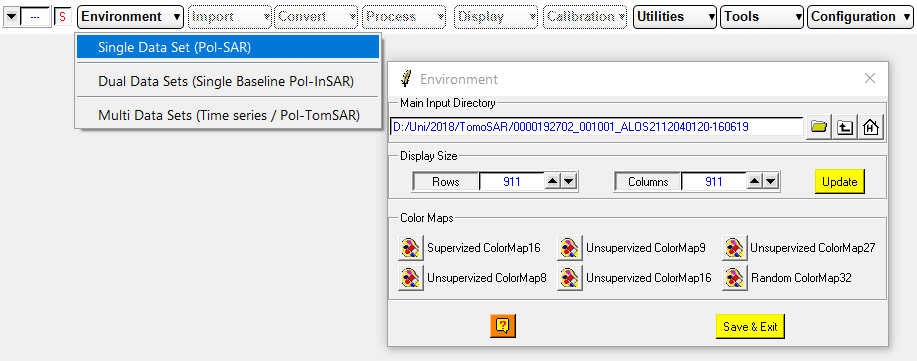
1. Create working directory “Single Data Set (PolSAR)”
I select the folder where the original data is stored and click “Save & Exit”. I confirm the upcoming message and proceed with the file import.
2. Import the scene
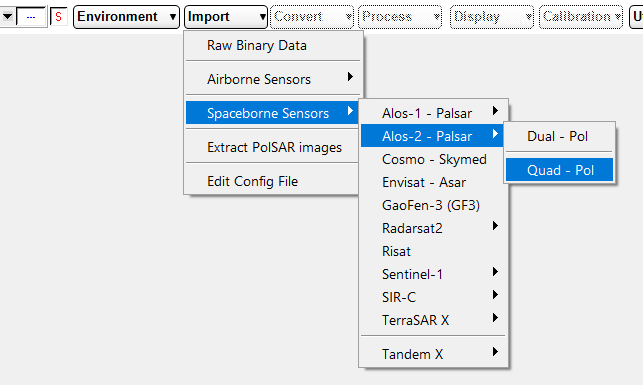
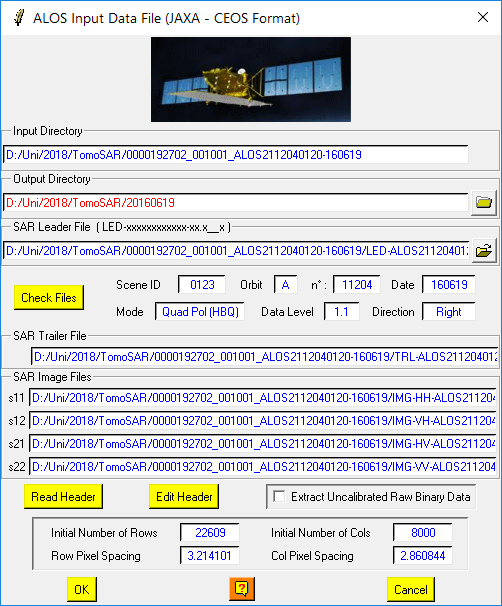
I select a different (by now empty) output directory so the imported data can be stored here seperately in PolSARpro format
I select the LED file and click “read header”. Everything is fine so far. I confirm with “OK”. Message “Dont forget to extract the data.”
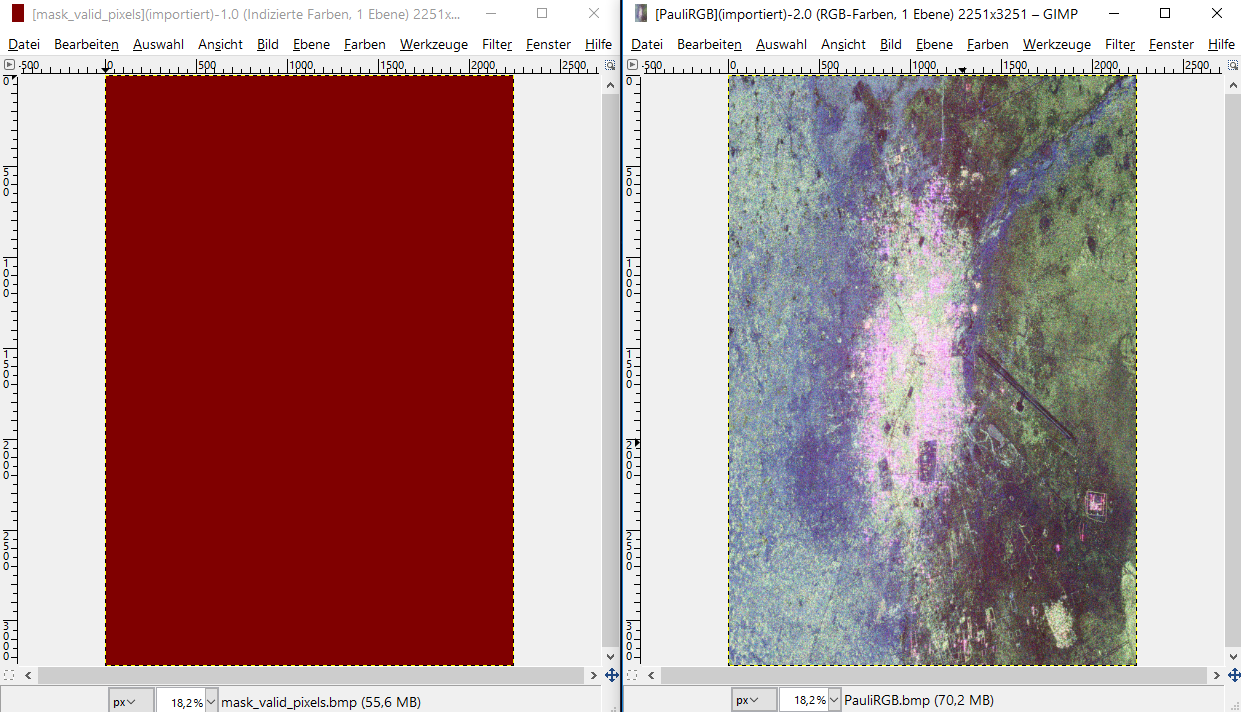
3. Extract the data
I select some subset coordinates and click on “OK”

A valid pixel mask and an RGB image are created
4. Repeat steps 1-3 with second QuadPol scene
I do the same with the second data set, I select a different output folder so both images are stored seperately.
Set the environment, load the data. Extract the data. I now have two folders with PolSARpro products.
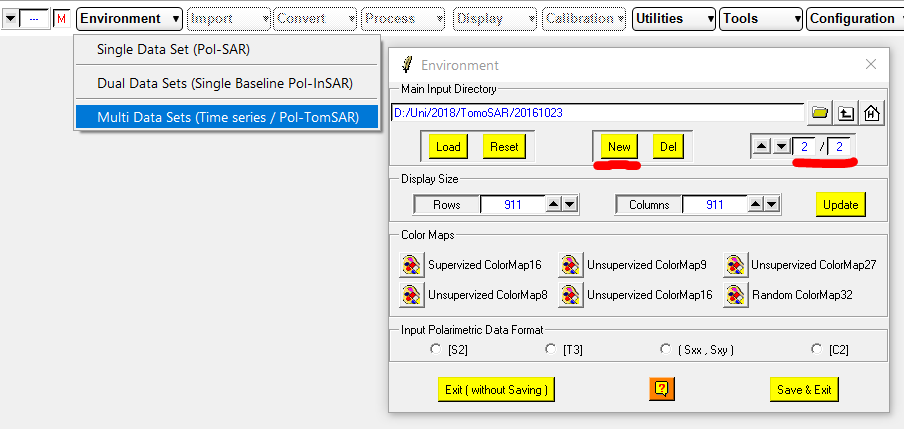
5. Load both scenes for the TomSAR processing
Environment > Multi Data Sets (Time Series Data / Pol-Tom SAR)
I first select the first folder, then click “New” and add the second folder. So I have 1/2 and 2/2. I select the S2 matrix and click “Save & Exit”
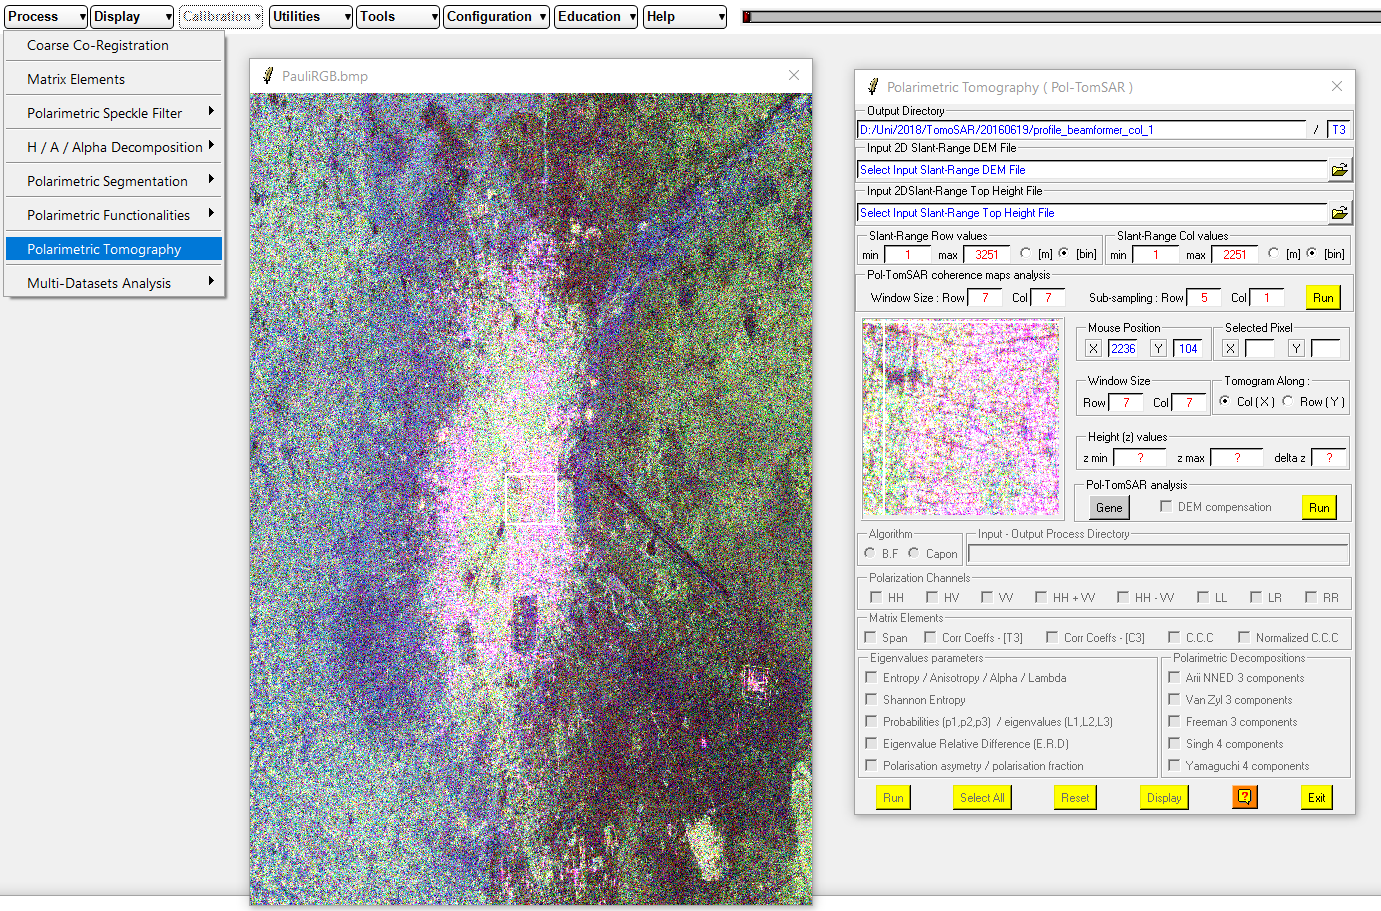
6. Start the TomSAR dialogue
Load > Polarimetric Tomography
I get asked for a BMP file so I select one of the two generated Pauli RGBs
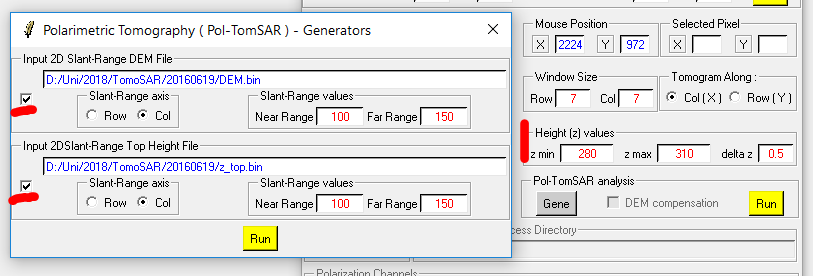
7. Generate DEM files
I enter DEM values and click “Gene” in order to generate DEM files. I select the checkboxes in the subsequent windows and click “Run”.
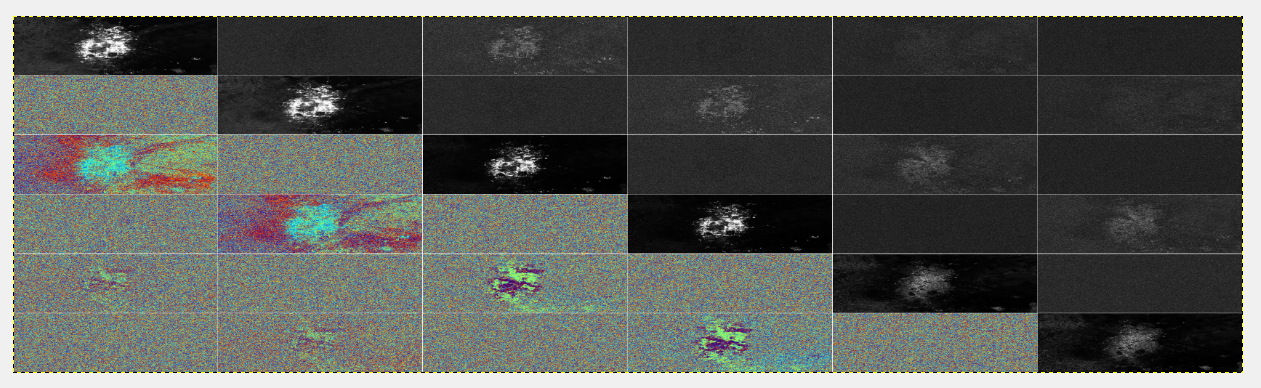
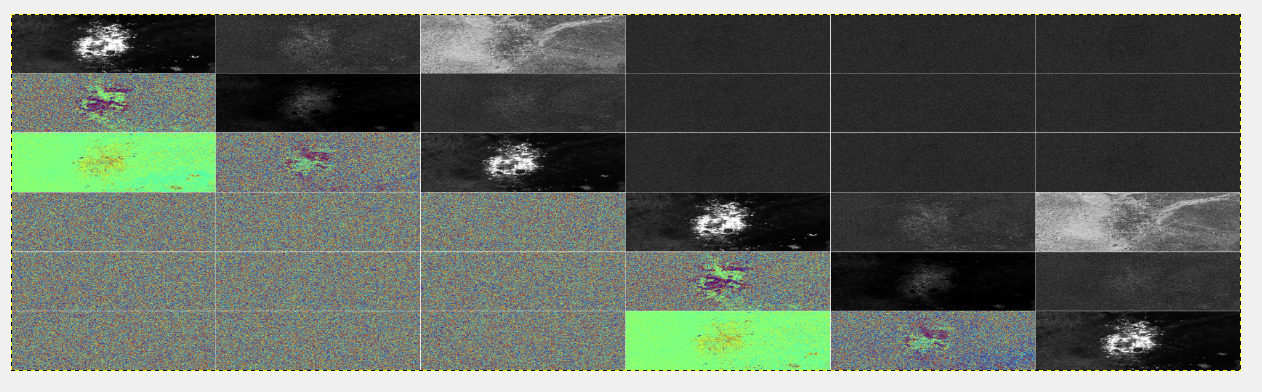
8. Display coherence map
DEM files are now generated and I start the coherence map generation
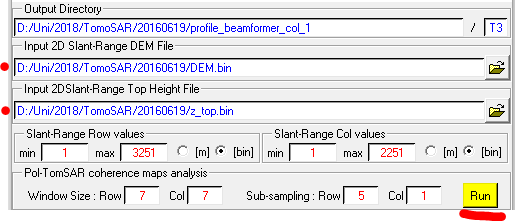
Results are looking great


9. Run it with DEM compensation
Checkbox “DEM compensation” then “Run”.
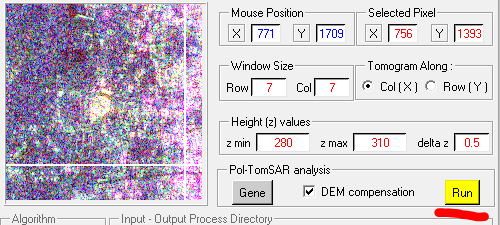
Here I get a runtime error and don’t know why
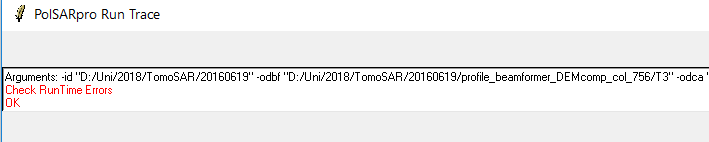
I also don’t know where to check for more detailled error messages. So I can’t go on with the profile analysis as described in the tutorials.
Running the analysis without the DEM compensation leads to the same error message.
So if anyone is able to add some ideas to this, I would be glad about a discussion.
- Is the process of importing the data correct?
- Do I need to co-register the data in a way?
- Do I miss a crucial point in the TomSAR dialogue?