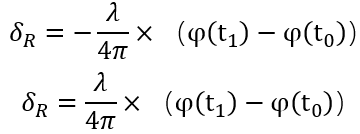
Some literatures add negative signs to the deformation displacement formula, but some do not add negative signs. What’s the difference?
Another question: when the value is positive, does it mean that the deformation direction is far from the satellite or close to the satellite?
this always depends on which of the images was selected as the master. If the earlier date is selected as the master, negative values indicate movement away from the sensor.
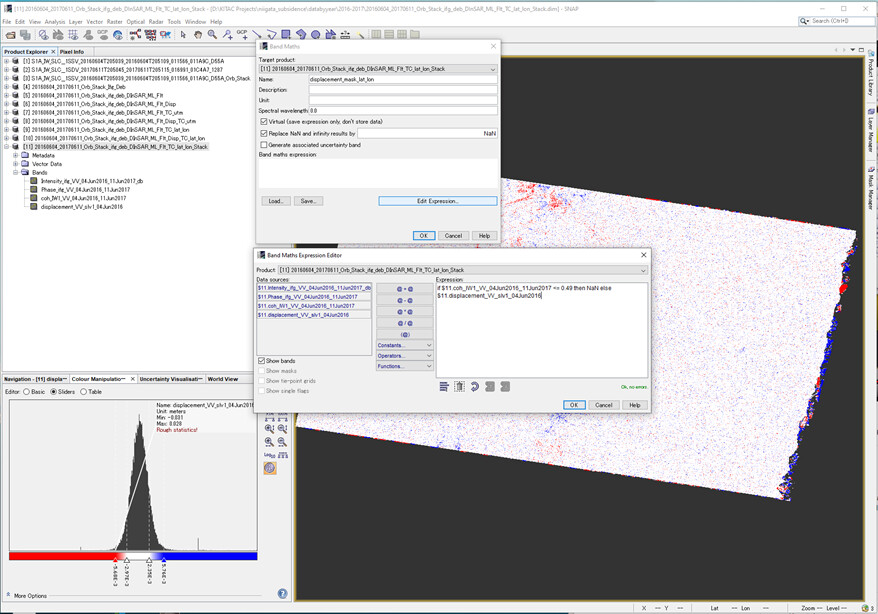
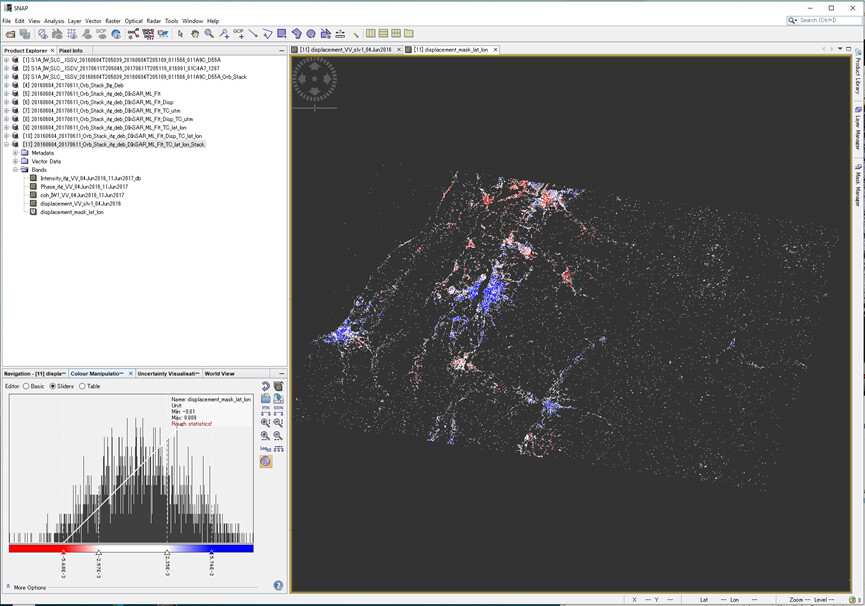
I am investigation a land subsidence. After unwrapping, i use phase to displacement of snap to obtain the displacement in the LOS direction. Then I applied terrain correction. In order to get more accurate results, I create a stack of DInSAR corrected product (DInSAR_ML_Flt_TC) and the displacement corrected product (DInSAR_ML_Flt_TC_disp). The minimum and maximum are respectively -0.031 m and 0.028 m. I export the color palette. From the stack product, I create a displacement_mask using band math to remove the area of low coherence. On the displacement_mask the min and max has changed and become -0.01 and 0.009 without indication of the unit.
Why the values of min and max has changed?
What is the unit of the displacement_mask?
in case the unit of the displacement_mask is in meter also. which values of min max shall I consider to be more accurate?
As you see in the maps, the mask removes pixels with low coherence where the phase quality is bad. This leads to a removal of outliers from your data and the value range decreases.
More important than minimum and maximum is if the fringe patterns in the interferogram make sense to your and if the are free of noise and atmospheric patterns.
Bad interferograms lead to bad results, so this should be checked initially.
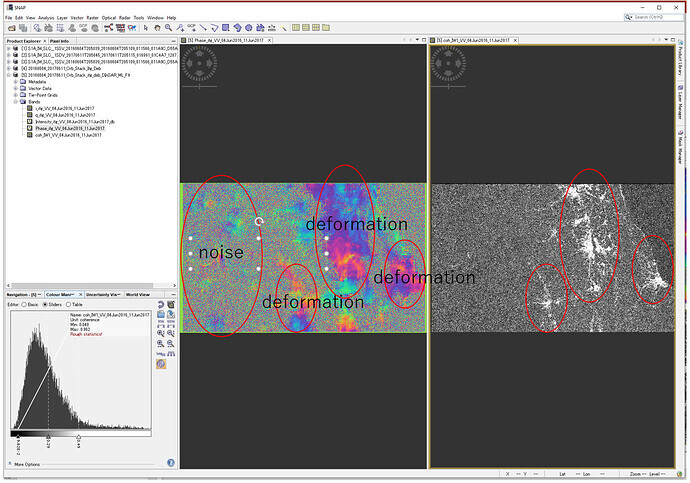
thank you for your reply. I herewith attach the interferogram result. Honestly i am not sure if it make sense or not but according to my understanding, you can notice that we have higher coherence in the right side of the coherence file corresponding to the fringe in the right side of the phase image. the fringe space are large mean that there is small deformation. therefore on the left side of the the phase image, there is noise since the coherence corresponding to this are is low.
what do you think about my fringe. does it make sense?
unfortunately, large parts of the image area completely decorrelated.
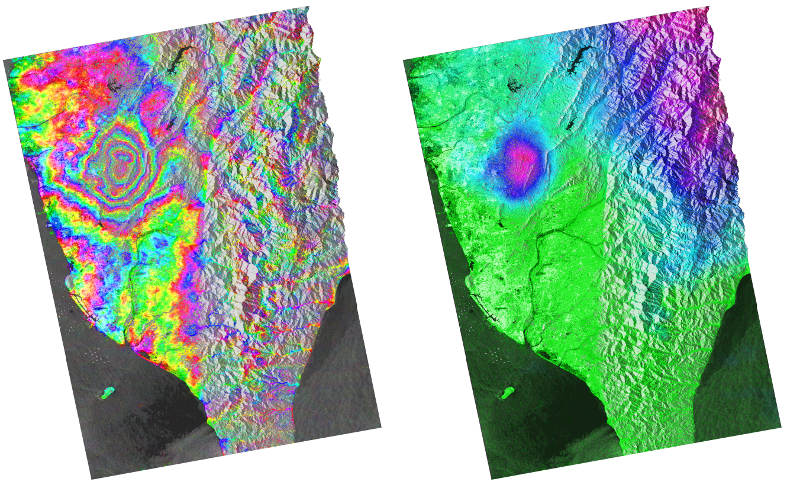
In an ideal case, subsidence patterns in an image should look like this or this. In these examples, it is very clear which patterns are caused by surface deformations and which are not.
In your example, there are rather random patterns which could as well be caused by atmospheric impacts. So if you try to unwrap such an interferogram, the result will not represent the true deformations.
The best option is to find an image pair with higher coherence. What is the temporal baseline at the moment?
Thank you for your explanation. the temporal baseline is about 1 year (master 20160604 and slave 20170611). based on the following equation : Φdefo = 4ΠvΔt/λ
Φdefo : displacement-related phase
v : surface displacement rate
Δt : temporal baseline
λ : wavelength
small deformation rates v requires long temporal baselines Δt to make sure that the displacement phase signal ϕdefo raises above the noise floor. therefore if also the temporal baseline is high, there is decorrelation. I am struggling to choose pair of image for Insar to measure slow displacement such as land subsidence
yes, that’s a dilemma. You need short temporal baselines for high coherence but long temporal baselines for subtle displacements.
What is the amount of displacement you expect in your area? If the quality of the interferogram is good, InSAR can measure at the sub-centimeter level.
the expected amount of displacement is about 5 to 10 cm. I am planning to reduce the temporal baseline but another constraint is that the area is covered by snow from about December to April. I afraid about the noise created by the snow
Dear Johngan
I need the source for the formula you mentioned about the vertical displacement, please.
I also need the formula for the horizontal displacement too, if possible.
Thank you.