StaMPS-Visualizer, SNAP-StaMPS Workflow

Dear @thho and @ABraun ,
Thanx for your reply and suggestions. I will use use updated version for visualization, thanx for the reply again. :slightly_smiling_face:

Hello!
I just finished this image below. Actually I have finished some images also. However there is something weird for me. Sometime it can running well, but sometimes cannot, I got “Error using horzcat”.
Anybody get the same problem with me?

Hi, I’ve been learned so much from your discussion. by the way, for the exported file (.csv) where do I can find it…??.. I just following matlab command that provides by @thho. this is the command :

ps_plot(‘v-do’, ‘ts’);
load parms.mat;
ps_plot(‘v-do’, -1);
load ps_plot_v-do.mat
lon2_str = cellstr(num2str(lon2));
lat2_str = cellstr(num2str(lat2));
lonlat2_str = strcat(lon2_str, lat2_str);

lonlat_str = strcat(cellstr(num2str(lonlat(:,1))), cellstr(num2str(lonlat(:,2))));
ind = ismember(lonlat_str, lonlat2_str);

disp = ph_disp(ind);
export_res = [lon2 lat2 disp ts];
metarow = [ref_centre_lonlat NaN transpose(day)-1];
k = 0;
export_res = [export_res(1:k,:); metarow; export_res(k+1:end,:)];
export_res = table(export_res);
writetable(export_res,‘stamps_tsexport.csv’)

thanks

usually in the directory that is active in Matab at the time of execution.
You can also give a full path in the last line, e.g. writetable(export_res,‘C:\temp\stamps_tsexport.csv’))

1 Like

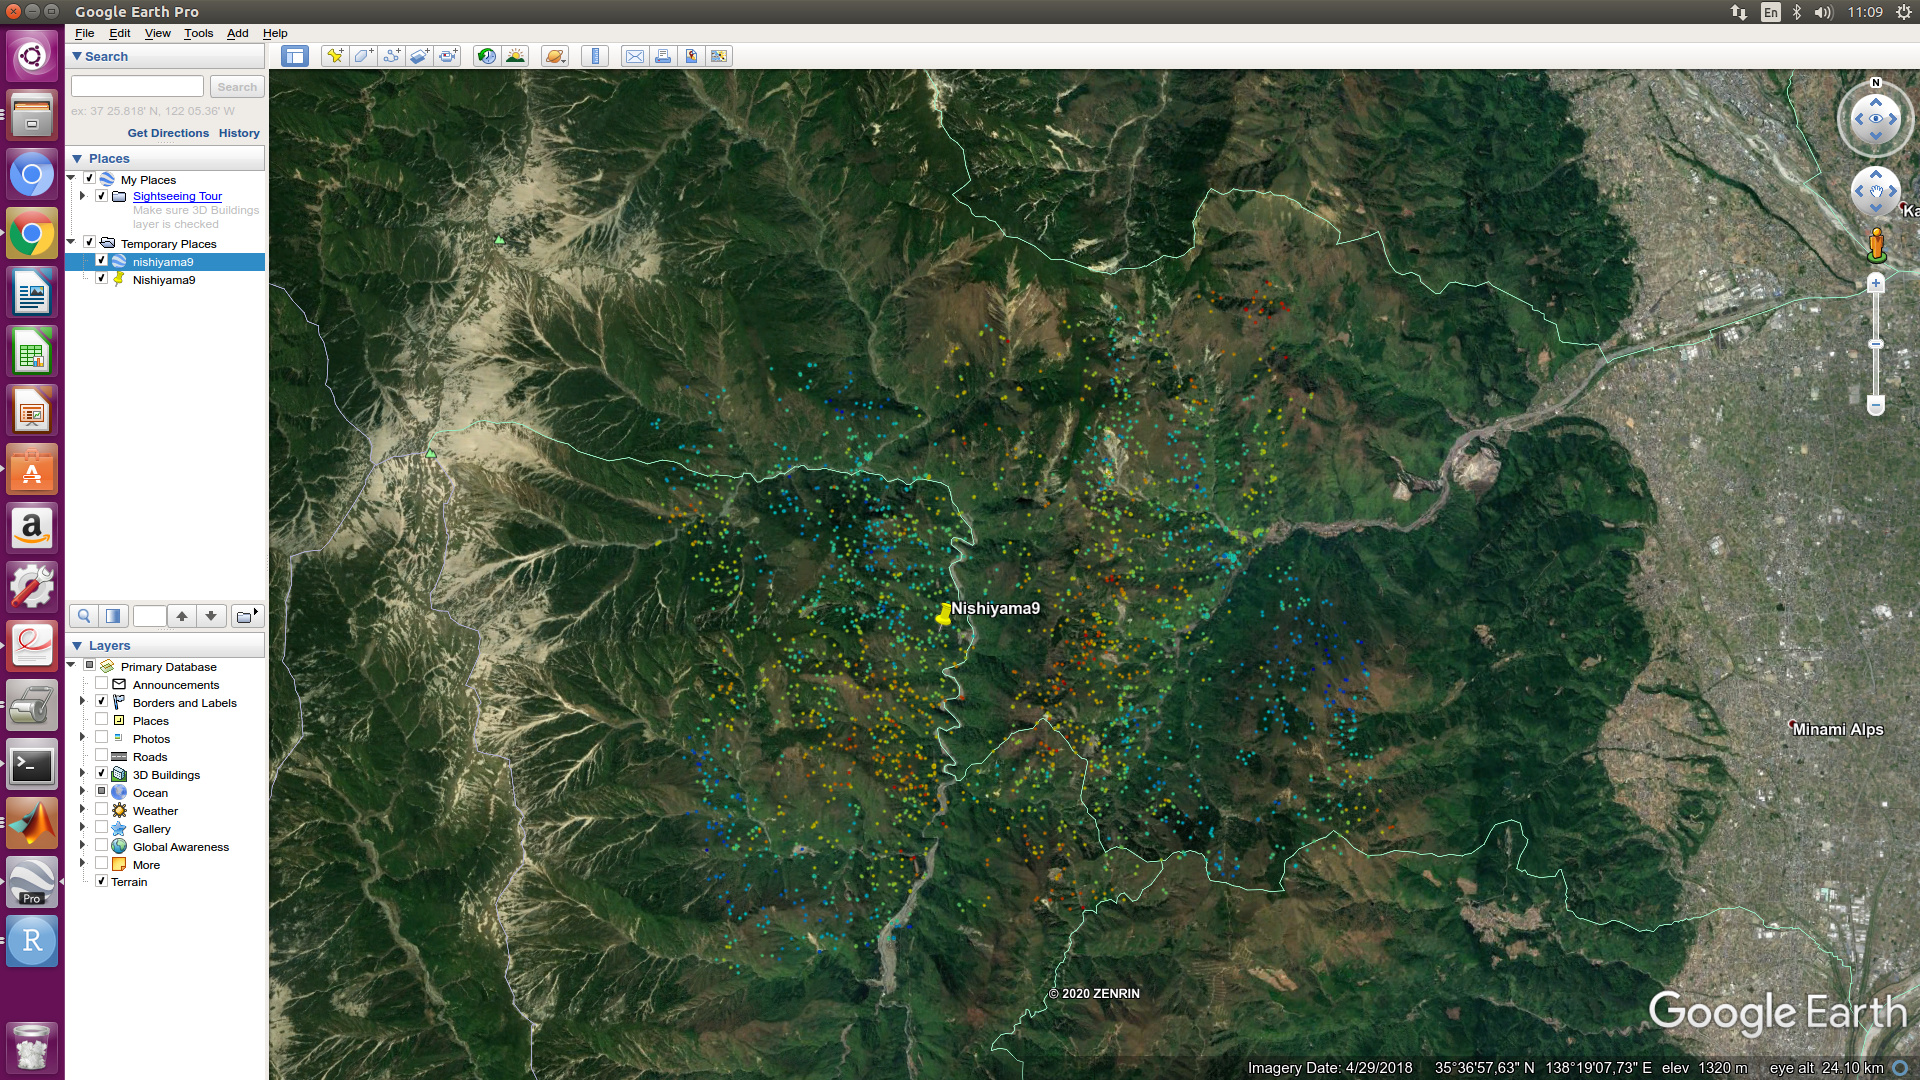
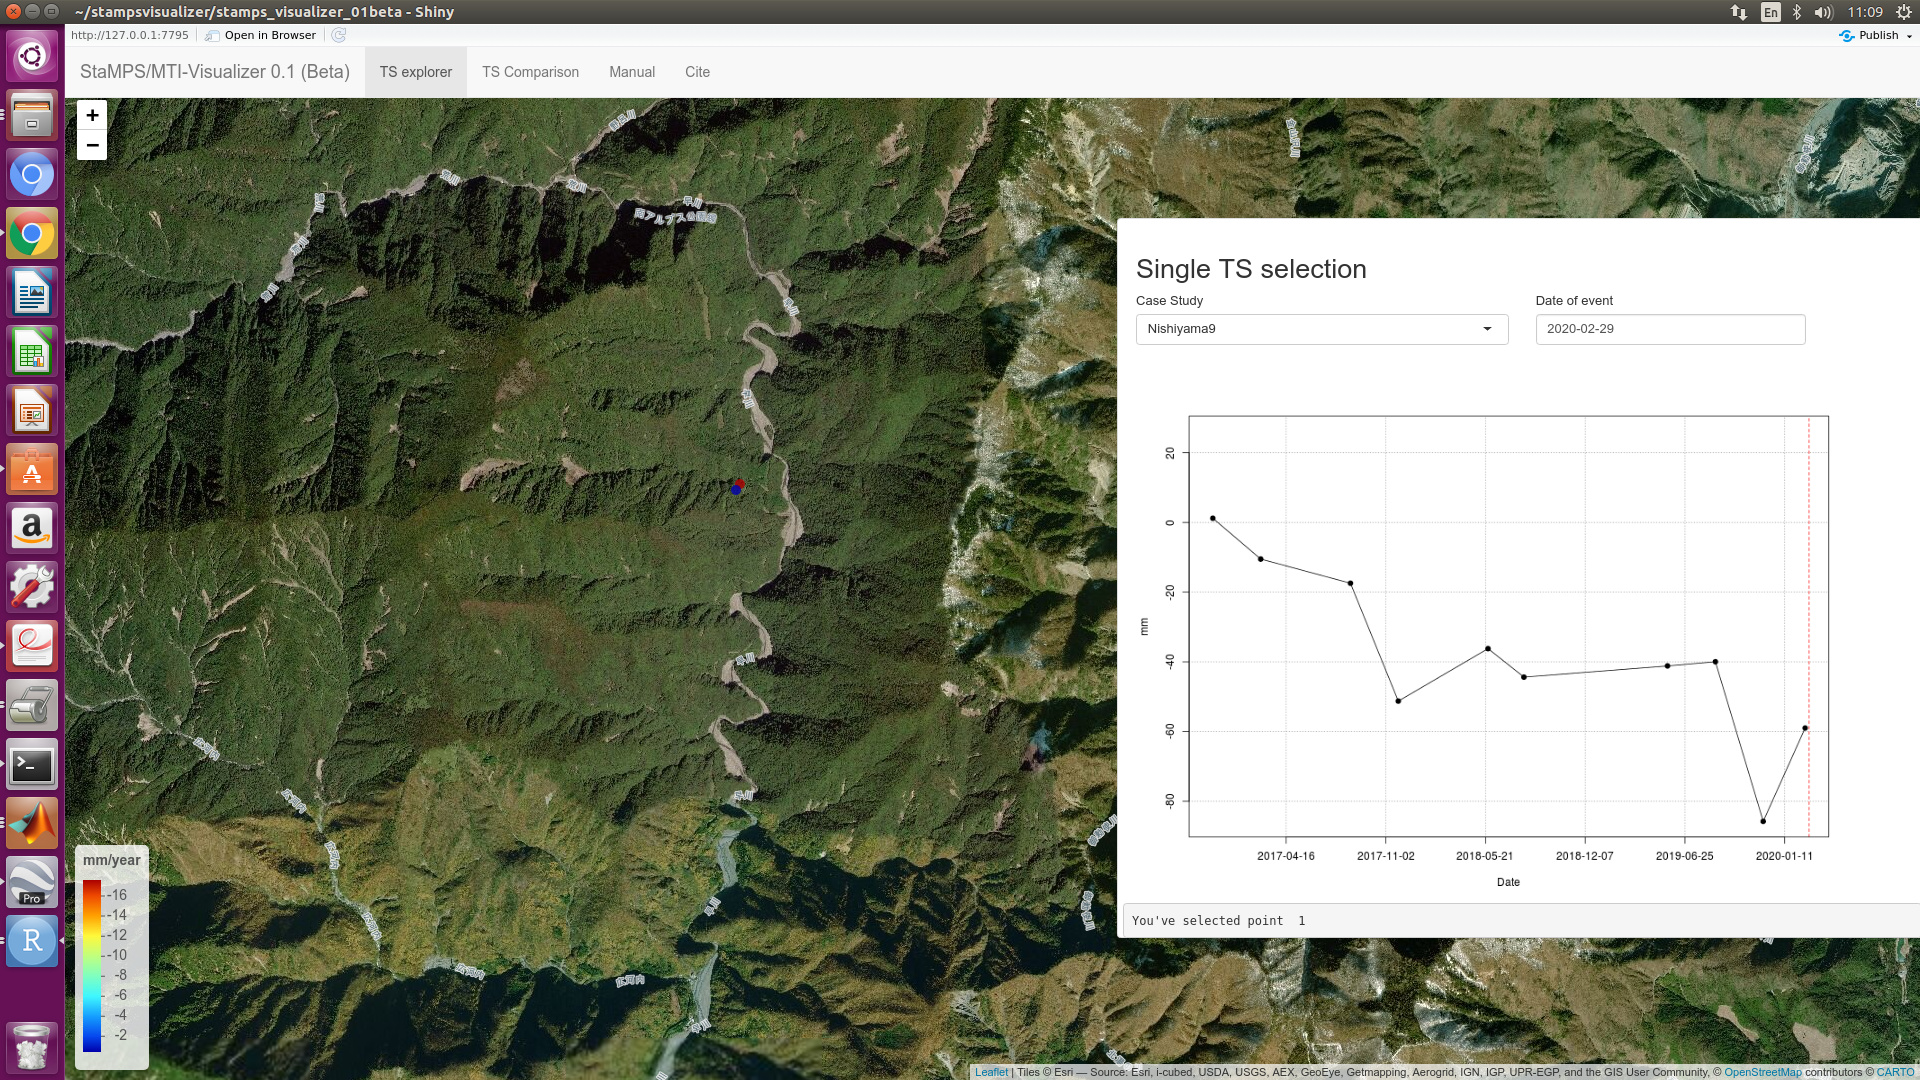
Hi,good day @thho, I was studying and learning from your discussion to create visualized stamps result using stamps-visualizer that you developed. I do succeed to viasualized my result to stamps-visualizer, but there are difference from google earth visualization and stamps-visualizer visualization. google earth has so many points, but in stamps-visualizer i got only 2 points. do you have any idea, where was my mistake…??..

and when I’m trying to export stamps result (stamps 4.1) using your script (script below), sometimes is working, but sometimes(another data) is not working. the is an error messages in matlab tells about error in Horzcat.

Thank you in advance

B.H.Husain

####MATLAB-Script####

ps_plot(‘v-do’, ‘ts’);
load parms.mat;
ps_plot(‘v-do’, -1);
load ps_plot_v-do.mat;
lon2_str = cellstr(num2str(lon2));
lat2_str = cellstr(num2str(lat2));
lonlat2_str = strcat(lon2_str, lat2_str);

lonlat_str = strcat(cellstr(num2str(lonlat(:,1))), cellstr(num2str(lonlat(:,2))));
ind = ismember(lonlat_str, lonlat2_str);

disp = ph_disp(ind);
disp_ts = ph_mm(ind,:);
export_res = [lon2 lat2 disp disp_ts];

metarow = [ref_centre_lonlat NaN transpose(day)-1];
k = 0;
export_res = [export_res(1:k,:); metarow; export_res(k+1:end,:)];
export_res = table(export_res);
writetable(export_res,‘nishiyama9.csv’)

concerning the two points, please provide a screenshot of the csv table you use.

1 Like

https://forum.step.esa.int/t/stamps-visualizer-snap-stamps-workflow/9613/99?u=badrulhudahusain

Hi @thho, thank you for responding my question, I’m following your suggestion to make a very big tsplot in matlab. I changes the tsplot radius into 10000, and it works, it covering my PS point in the area. I just managed my stamps visualizer in Japan. Thank You

1 Like

@badrulhudahusain Cool, looks nice :star_struck:

1 Like

Hi @ABraun,
I want to try the time series in QGIS 3.10 with my exported ps points. attached is my data prepared in csv as indicated by you on this forum.

But the time series in QGIS does not work.
Do you have a solution?
Thank you

it looks like a rather old version of QGIS, because I am missing the option “first row has field names”

this would allow QGIS to understand that the columns contain numeric values. Currently, all colunms are interpreted as text.

I am also missing the chance to determine the columns which contain the coordinates.

Hi
Do you mean my QGIS 3.10 is an older version. I pretty sure this was the latest before the recent release of 3.12 on 21st Feb, 2020.

I don’t know which version you are using but you should somewhere find the option to declare the first line as column name.

I’m pretty sure this was included way before version 3.10, but I’m not familiar with the specific changes of QGIS distributions for Linux.

Dear All,

I am moving this question to the StaMPS-Visualizer thread in the hope someone can assist. When I export my results to CSV the longitude coordinate is limited to 7 digits. For example, in New Zealand my study area has a longitude of 175.xxxx, so I have only 4 decimal places. My study area longitude in Nicaragua is -86.xxxxx, so I have 5 decimal places. This creates bad accuracy for my New Zealand results (below), where many PS appear in the same location:
image

Is there a way to allow 8 digits in the StaMPS-Visualizer export?

@wharfbanger hmm good point indeed, thanks for making me aware of that, since I do not have a dataset to play around with, please provide me some screenshots in matlab after running the export script of:

  • the object export_res
  • the object lon2
  • the object lat2

If they are “longer” in matlab, maybe the export function to csv does something what we can change

1 Like

Hi,good day @thho, hope you are well. I just wondering after I make a comparation over 2 stamps result processing area (city area and rural area). it seems like the density point in rural area is way more less than in city area. could you give me some brief explanation. or is it just city area has builted area and it has increasing the mass above ground, so it can sink.?
Thank you in advanceUploading: Futaba.png… Uploading: Nishiyama_line_9.png…

@badrulhudahusain its because of the basic concept of PS described in Hooper 2007 in built up areas you have more persistent scatteres/more stable points that are found by StaMPS which you can track over time, in rural areas you have more pixels with an unstable phase, that are sorted out by StamPS, which leads to more measurements points in buzilt up areas as in rural/vegetated ares…You can find the details in the paper mentioned above.

3 Likes

Ah I see…thank you @thho :+1::+1::+1::+1:

OK I will try this when I get the chance, and thanks for the response.

Hi all,

I’m using the MATLAB code to export the .csv file but this error appears, do you know why?
I’ve noticed that when I change the radius the list of ps coordinates does not come, regardless of the value I choose. Furthermore, the file ps_plot_v-d_mat is not prensent in the folder, for this reason in the third line I used ps_plot_ts_v-d_mat. I don’t know if theese have anything to do with the error but they are the only changes I made compared to previous times, when the code worked.

immagine

Thank you in advance,
Evandro