with only one orbit, you may be neglecting or losing information, obtaining only partly the vertical signal, this could be ok if both ascending and descending says that you have the same phenomena (subsidence or uplift).
If ascending and descending orbit show different phenomena, the result decomposition shows predominance on horizontal movement, and could reach even that vertical deformation is not happening. This always depending from case to case.
if ascending and descending show both subsidence, surely the final vertical movement will be subsidence, but you can not assume this before getting both results.
I strongly recommend to get both ascending and descending results before publishing any partial projection of asc and desc, instead to get the real one, only possible with both geometries, as you may publishing not real results.
Results of horizontal and vertical decomposition are several ones, so please just search in literature (from PSI results https://www.mdpi.com/2072-4292/11/2/129/pdf) but as this is mine, please search other sources as well to convince yourself.
It is better to show LOS results, that uncomplete vertical ones… this is my opinion
I do indeed use both ascending and descending orbit because of the reasons you mention that is widely discussed on this forum.
My AOI is only prone to vertical displacement since i am investigating subsidence due to permafrost, this is why i use the ‘‘simpler’’ formula that just uses the incidence angle and assumes only vertical displacement.
I have read multiple papers on the topic of combining ascending and descending data including yours to obtain the 3D displacement but i must say the process dazzles me! Unfortunately no scripts are available for computing this and due to time limits i am probably not able to construct these myself. Although i am a perfectionist, for my 3 month during bachelor thesis more is sadly not possible since i have to analyze the data and write a paper as well.
Most people looking for the vertical displacement, including @dianalalitya for whom i asked the question are just looking for the simple formula although this is indeed not perfect.
Your statement about showing LOS displacements is indeed correct, especially if you only relate the displacements generated with each other and have no ground truth comparison.
I agree with you.
I wanted just to be sure you know the assumptions you are taking and that these kind of assumptions you can only do if you have further information, and knowing that you will be neglecting other signal.
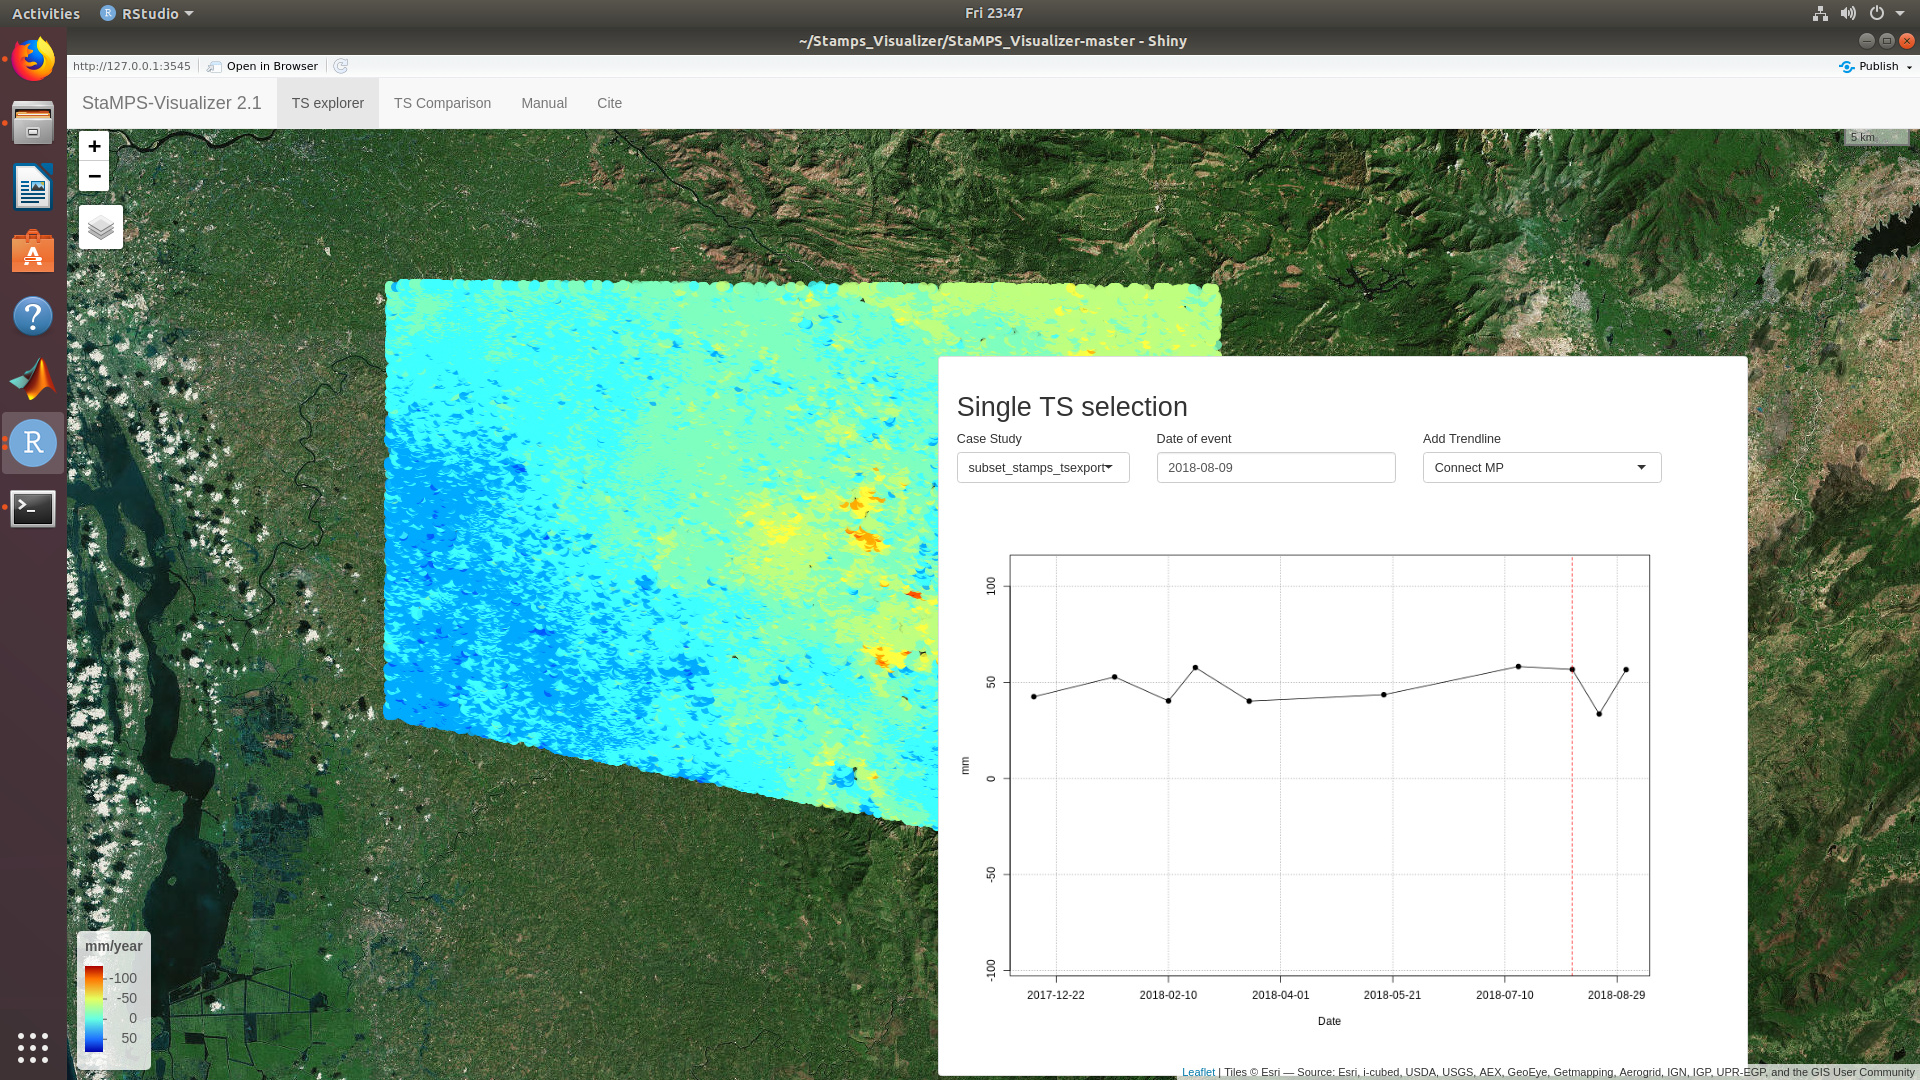
the visualizer starts by displaying the first point…which point that is, is pretty random, depending on your data set. just click on a point in the map to get tet info of this point. There is no option for mean time series yet. So @mdelgado is right.
your point density is very very high…you should increase the weeding parameter in StaMPS
it looks like that there is a ramp in your data, have you apllied the deramping? If you do not know what I mean with that, have a look at the StaMPS manual, and read about all options during steps 5-6 and considre using them
and btw, nice to see that you have managed the processing, now you can play with the parameters of StaMPS and by time you will get a good feeling for them and what they do…I suggest using the Visualizer massively to check about what happens to your data after changing parameters…I learnd a lot this way and it was the motivation for the app in the first place. Good luck!
save what? the time series? There is no direct way to save the plot…I can work on that if it is useful. The TS comparison is a bit messy to use and I do not like it a lot…I even thought about excluding it again…but still if you want to use it, every time you select a point in the map, beneath the plot there is the info of the number of the point. You can use the single PS viewer to look up some interesting points, note done the numbers, change to ts comparison and select the numbers from the dropdown…which I do not like but have not changed it yet. After that you are able to see multiple time series in one plot.
My Rstudio get hanged at times as i have numerous point is guess… So it takes ample time to do each step… Will follow your suggestion by increase the weeding and work with less number of points in order to get good interaction with the visualizer…
Decreasing the amount of points is a good idea…the rendering with the visualizer is pretty expensive concerning computation…if you are happy with the PS density, but you still have a lot of points, you have to work with spatial subsets and display the points after an other…but for me, weeding was fine all the time
Even i find more number of points and it confuses me on focusing with the essential MP’s… I thought of subset too and i did try it, even so the density of points are very high and i get numerous ones… I think i should opt weeding…
However, While running stamps in matlab i so far just used stamps(1,1) then stamps(2,2)… likewise command to run each step, and i dint know that there is an option to change the parameters… Where should i change the parameter? I went through the manual and it has a detailed explanation on the utilization of each parameter. But i am not sure where to modify those…
"You can modify any parameters from the default using
setparm(‘param name’,param value)"
i found this in the manual, should i use this prior to the stamps(5,5) or likewise?
And @thho, i would like to read your publications or thesis if any (if available), so that i could do better in inferring the results i have obtained… Kindly send me if possible (jacijenni36@gmail.com)
The best way to work with different parameters in StaMPS is to first prepare a excel sheet or something where you note all parameters and how you change them for each run…I promise you, you will really like that, because you will do a lot of changes…and I lost overviewa after a while and started then using a list to note all things down…
In StaMPS you have an object in which all parametrs are stored, before each run, change those as you like and then you can more or less run through all steps as you did before. You change parameters with
setparm('parameter_name', some_value)
hmm have a look at this tutorial, helped me to get a better understanding what the single parameters do…
i have corrected my results to vertical displacement and combined ascending and descending data and would like to explore the results in your app but…
I think because the data structure changed i am not able to load the the app, this is the error i am getting.
runApp(‘INSAR/stamps_visualizer_01beta’)
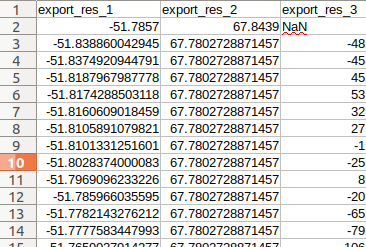
Error in [.data.frame(dat, 1, 4:ncol(dat)) : undefined columns selected
because i cant combine the displacement data per date because the dates between asc and desc vary i have only the velocity, so my data looks like this:
is there a workaround for this or do i have to setup the rest of the csv with fake data?
A quick way would be to create one or two aditional cols with fake data…I can work on that, would not be so hard to do that but atm I do not have time…if you want this feature in the Visualizer, please open an issue on github, otherwise I will forget about it…
Btw nice work, I am still interested in your scripts, you can add me to your repo on github.com by adding cotributers to your private repo…if you need more guidance to do that, send me a PM
first have to sort my own business for this project then when i have a bit more time i will work more on the scripts, then i will add you to the git for sure!
Whole idea is to make a more steady workflow between SNAP, snap2stamps , StaMPS and stamps_visualizer so your input is welcome.
do you have experience using TRAIN in StaMPS?
i want to use the powerlaw method for my area but only the linear method runs without error. I am unsure whether i could post a thread for this error here… the TRAIN forum is quite dead and has no similar problems and i think the problem originates from StaMPS since it has to do with matrix dimensions.
 to obtain the 3D displacement but i must say the process dazzles me! Unfortunately no scripts are available for computing this and due to time limits i am probably not able to construct these myself. Although i am a perfectionist, for my 3 month during bachelor thesis more is sadly not possible since i have to analyze the data and write a paper as well.