Dear ABraun:
Please tell me how to add the interferogram(*_split_orb_stack_ifg_Deb) of the (1-2 image and 2-3 image and 3-4 image).?
as written in the other topic, currently SNAP only supports the creation of S1 image pairs with the same master. 1-2 1-3 1-4… To automate this, you can use the Snap2stamps package: a free tool to automate the SNAP-StaMPS Workflow
hey @virk_rana,
Can you please tell me how you are saying that the given values (-0.076 and +0.028) are in km? Can we change them to cm or mm in the map only?
Thanks.
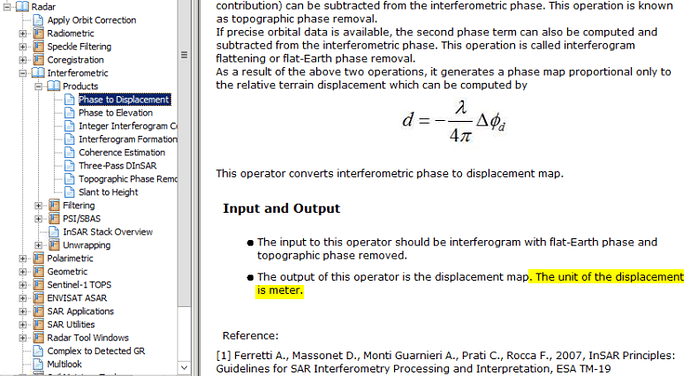
you can find such information in the help section
You can use the band maths to convert between the units
Hi dear all,
How can I have colour scale for my kml in Google earth?
thanks
If you applied a color scale in SNAP it is exported as “Legend” inside the kmz file actually.
But I exported the kml file in MATLAB.
sorry, this was not clear from your question.
I also apologize that my questions were not clear.
Hi @ABraun ,
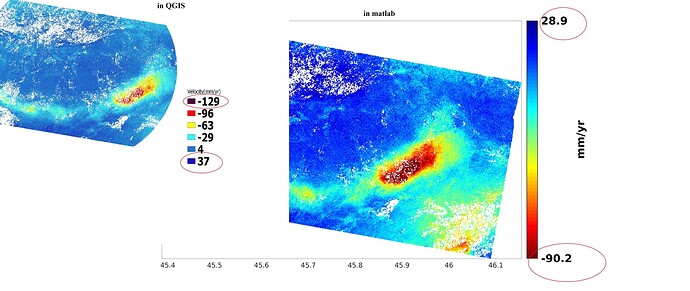
When I processed the Sentinel images using the PSI method in MATLAB, is the amount of displacement( ps_plot (v_do ) obtained different from the amount of displacement shown using the CSV export in QGIS? Which is the actual displacement value. I’m really confused.
QGIS has its own way of color stretching. These values do not represent the total min/max values.
Also explained here: Export of products from SNAP (chapter “Notes on contrast”)
Thanks for your very helpful answer@ABraun,
This means I have to open the csv file in Qgis and check the minimum and maximum, it will be the actual amount of velocity? Right?
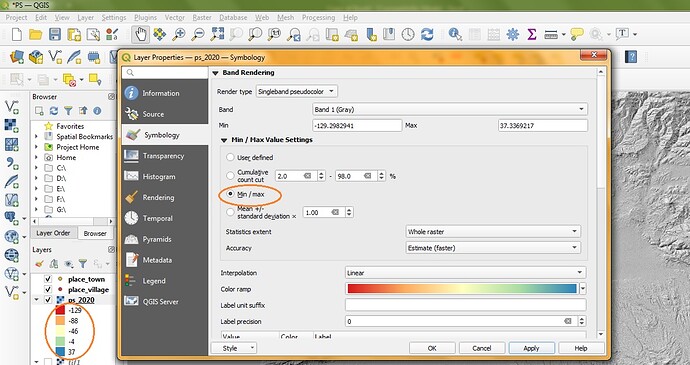
No, you can set the real min/max in the QGIS symbology settings.
Please see here: Wierd values around my colored image from SNAP to QGIS - #10 by ABraun
thanks a lot @ABraun , I have to set like this, right?
StaMPS plots do not cover -min/max range.
Please check the function ps_plot
I cannot remember if it was 2-98% or so…
@despina98
Yes, and under Accuracy > Exact
We discussed the same here, please check: Interferograms results and ALOS PALSAR DEM - #28 by adojeda
But as @mdelgado said, StaMPS also applies a contrast stretch. Still, this does not affect the underlying values, just what color scale is applied.
not underlying values, but limit values in the color bar
Yes, this does not grant that there are no values beyond this range. But their proportion is small ans extreme values should be interpreted with care. More important is the spatial pattern, the value at stable areas (correct reference height) and if the range makes sense in general.
@mdelgado @ABraun Now how do I interpret the minimum and maximum displacement? I was confused again.So what do the plot values mean? What do the values inside the QGIS mean?Can I introduce a value of -129 as a displacement?
they mean the same (depending on the plot command - what did you type?), just the color assignment might be different between the software packages.


