I am trying to extract waterbody for Vietnam for last 5 years using S1 data in SNAP tool, however the backscatter coefficient value keeps on changing for the years.
Is there any way to Standardize the value?
I am trying to extract waterbody for Vietnam for last 5 years using S1 data in SNAP tool, however the backscatter coefficient value keeps on changing for the years.
Is there any way to Standardize the value?
have you performed radiometric calibration?
are you using data of ascending and descending orbits?
Yes, radiometric callibration is done.
Using ascending data.
You have any solution to standardize the BS value?
so you excluded most of the internal variations.
Another aspect is the roughness of the water surfaces which influences their backscatter intensity. Also if there is seasonal change of smaller water vegetation, this could cause the absolute backscatter to change betweeen the images.
You can stack your preprocesse images and use the pin manager and extract backscatter values throughout the whole investigate period to determine the degree of temporal variation. This might help you to define a threshold which is valid for the entire period.
Will this work if the images are of different dates across different years?
If they are calibrated, yes.
Downloaded the image for 2019 March but on doing Speckle filter it says “Source product should be deburst first”
I am new to SNAP though and not getting this debursting error. Help?
you can download the GRD products (instead of SLC), they don’t require the debursting step.
I have all the required images. Stacked them and also fixed few of the waterbody with Pin manager.
Now I am stuck with finding the backscatter value for those points.
When you say “use the pin manager and extract backscatter values” how exactly do we do this?
And is it possible to get BS values using pin manager? Or is it always using histogram?
please have a look at marpet’s explanation: How to extract value from sentinel 3 OLCI maps for a specific point.? - #2 by marpet
also described here: Export values from Sentinel 2 - #10 by ABraun
Thank you so much ABraun for this. I have learnt something new. And also thanks to this particular forum.
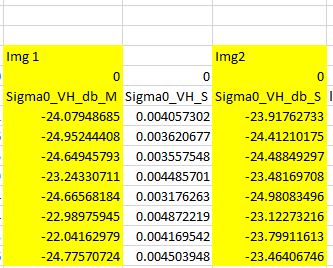
For testing I have just taken two images. Now I have the BS Values with me for Waterbodies for both these images. But they differ. Attaching a screen shot. Is there a way that based on these I can define a range for the waterbody.
But since my study is to estimate the surface water area every year for crop monitoring will i t help if I define a standard value for water every year? I mean it might change right. And if it does will it not affect my analysis of crop monitoring?
Thanks in advance!!
To get a better understanding of the variation of backscatter intensity in water bodies you can digitize their surface and analyze their statistics with the statistics tool, e.g. to find their 90 percentile.
Described here: Ellipse drawing tools
And here: Classification Sentinel-1 problems with MaxVer
There are many topics and diso on water body delineation in here, you might want to have a look at some of them to compare different approaches.
Thanks, I will have a look.
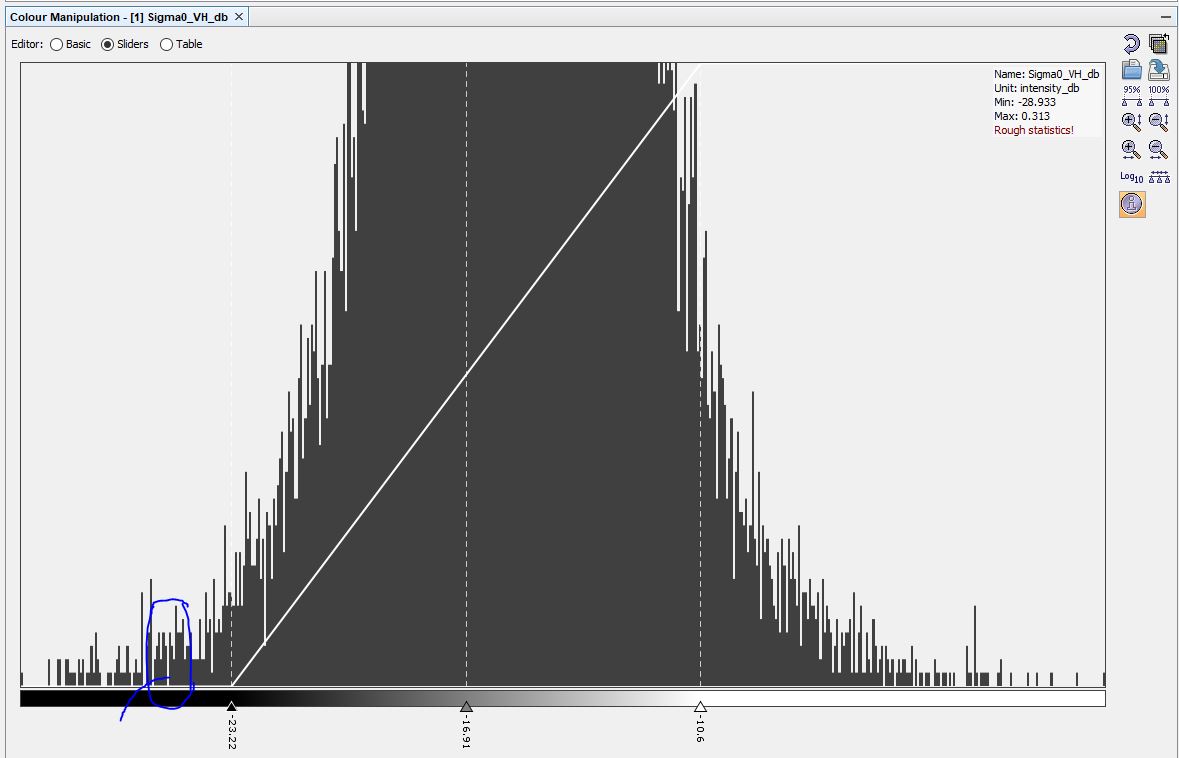
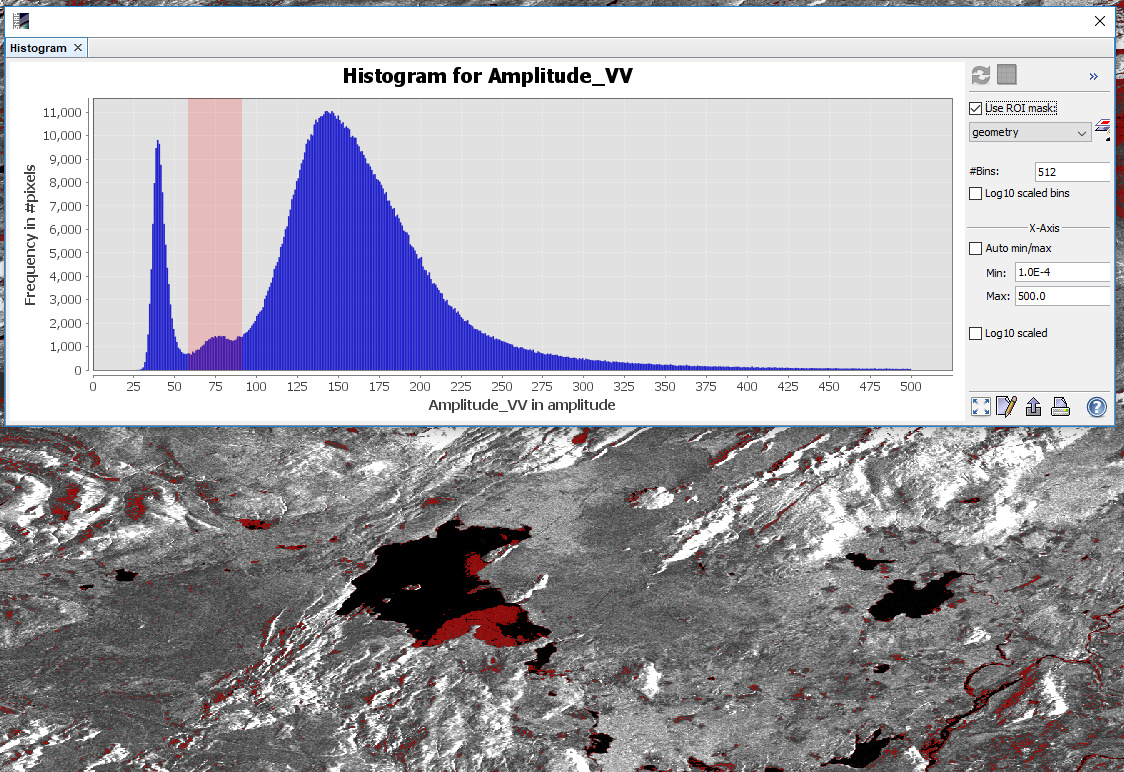
I was checking to get the BS value of water by using the histogram… few of the Literatures say BS value of water is the point where is it getting differentiated from others in the histogram. Does this mean the first drop is in the histogram in the BS for water? Please refer the image attached.
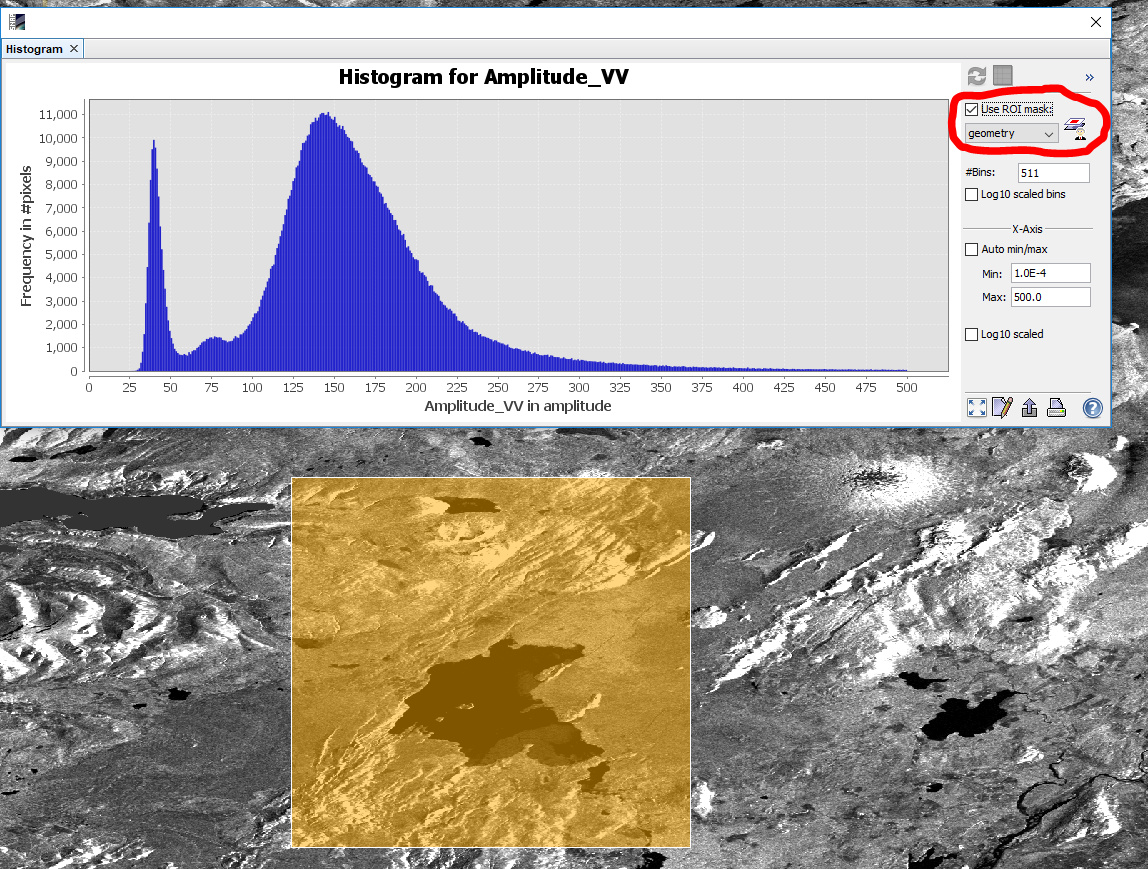
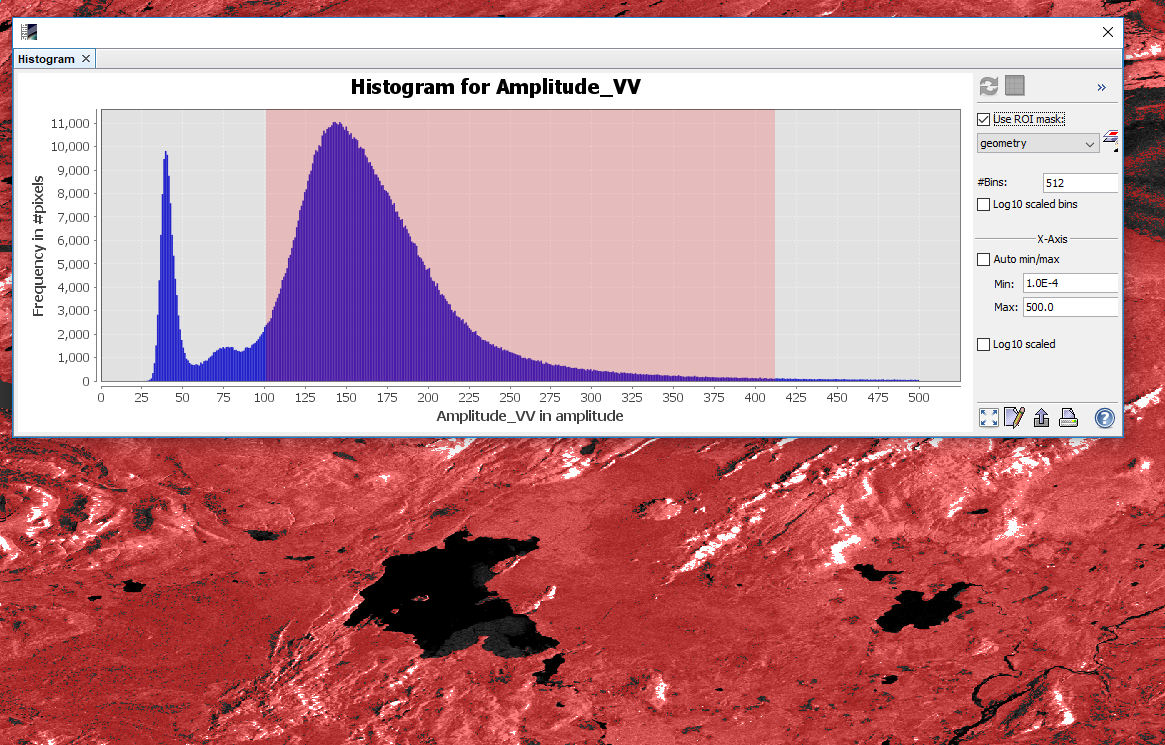
Your histogram is probably not balanced enough for this. To really see a bimodal histogram with a clear low point, water and land pixels must be balanced within the observed image. As the dark water bodies are mostly underrepresented, you have to digitize a square which equally covers land and water bodies. Use this as a ROI in the histogram tool to see a more suitable histogram for the identification of a threshold.
Without ROI
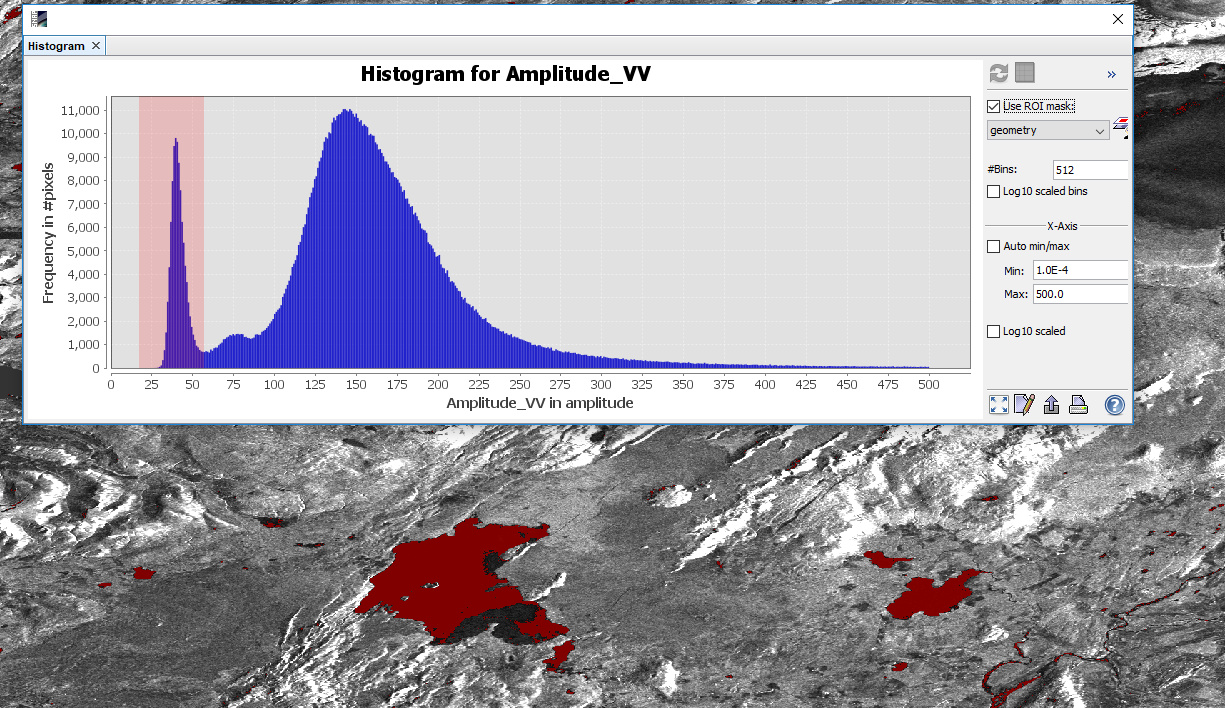
With ROI
So which is water BS here in the histogram? The first start of the peak?
as you see, the lake has two levels of dark colors. There might be vegetation on the sourthern part which increases the backscatter a bit (or the water is simply a bit more rough at this point) so the large peak is the dark water and the smaller is the water with the grey signature. It depends on what you want to have.
