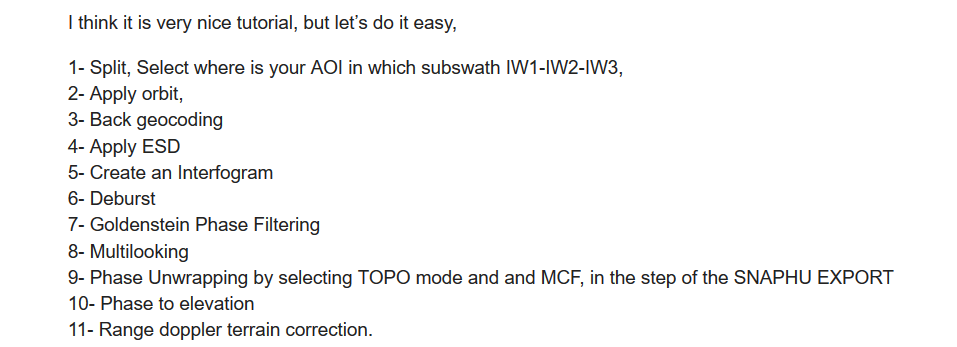
Please take a look at this steps in this post,
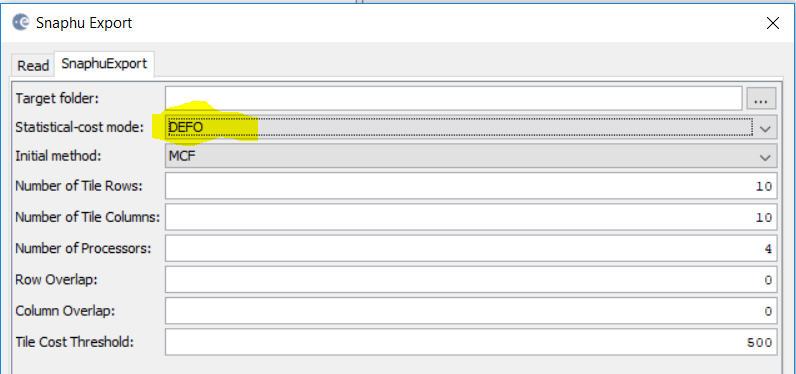
However, in your case step 9 is as below,
And step 10 is phase to displacement instead of what is mentioned in here,
Concerning the reference point, I think it well discussed in this post,