It’s ok. Thank You.
@SaiKiran
please have a look at this page:
https://senbox.atlassian.net/wiki/spaces/SNAP/pages/30539785/Update+SNAP+from+the+command+line
At the bottom is described how you can configure the proxy without using the SNAP GUI.
If you can use the GUI you can go to Tools / Options in the menu. Switch to the WWW tab and configure the proxy.
hi team,
I’m very sorry for this question,
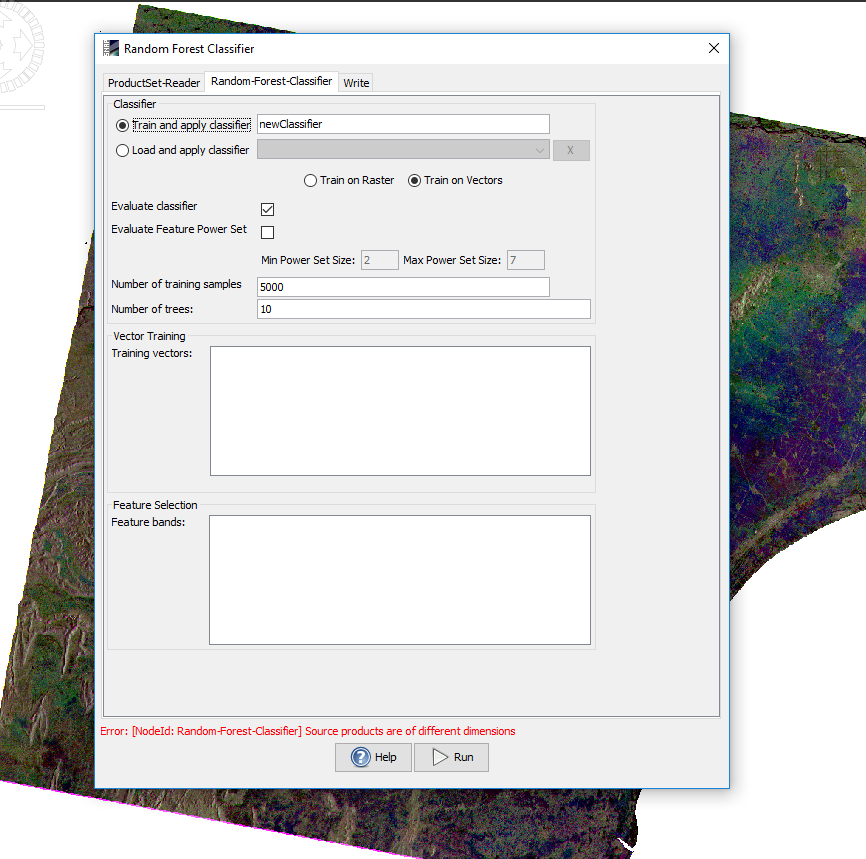
while doing the supervised classification getting the error as source products are of different dimensions.
following the above discussions but I’m not able to do rectify.

could you please help me to overcome this.
thank you in advance.
This error is discussed in here, read the post carefully many solutions and suggestions are available
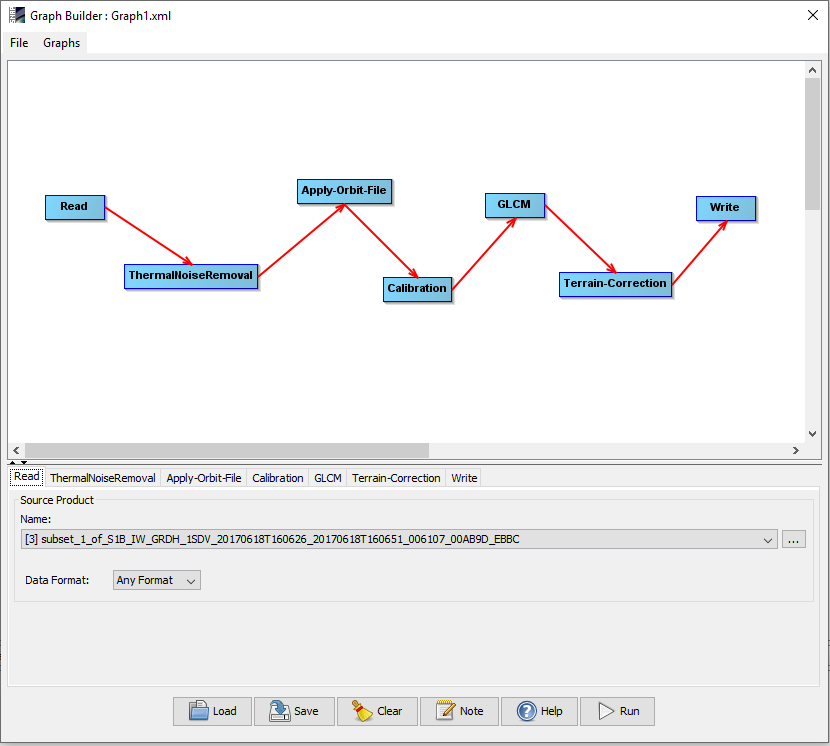
Here also, you could find the step of the classification,
sir from the above he did with sentinel 1 and sentinel 2,
but I’m doing for only 3 sentinel 1 images.
thank you in advance
you have to make sure that all your rasters are in the same coordinate reference system (the one you selected for terrain correction)
You can check using this one ![]() if all of them have the same projection information.
if all of them have the same projection information.
As @ABraun mentioned be sure
But in your case I think your input is S-1 GRD, is that right?
In this case your vector, as it is your train on vector, the reference system should be same to S-1 Lan/Long EPSG:4326 WGS84
thank you for your quick response
sir every image in the same coordinate system, because i done the batch processing for these all images.
sorry sir I don’t know hoe to check this![]()
thank you for your quick response,
yes sir my all inputs are S-1 GRD.
you mean my input vector also should be in the same coordinate system of S-1 TC products.
Yes, exactly
Thank you for your good response
I got the solution for that but, While doing the RF classification for the GRD products getting the error like bound must me positive, sorry I don’t know what it is
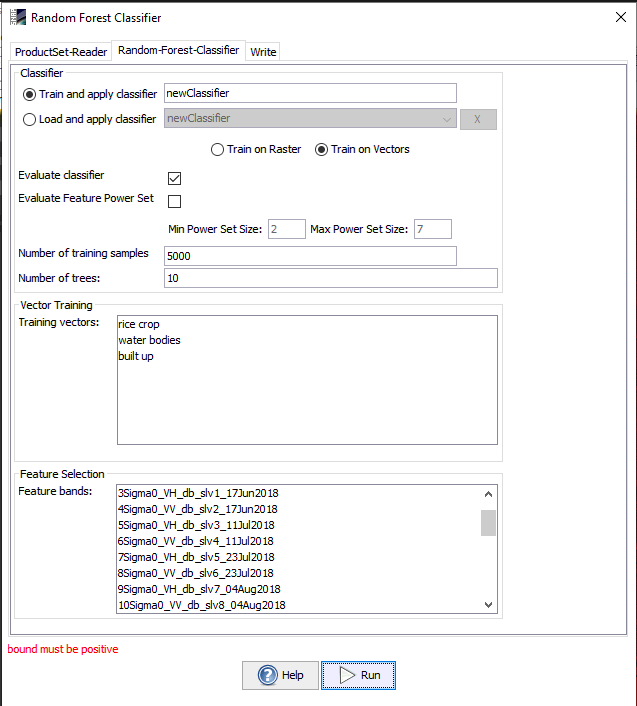
could you please help me for my classification.
and also sorry for my lack of knowledge, I have one doubt the classification which we are doing is on what based will be classify?
is it color based or backscatter based? please give me some guidance.
thank you in advance.
your data must be reprojected into WGS84. The solution has been given here: Rndom forest classification steps - #22 by ngtrananrsc
radar data is not measurung colours, it operates at higher wavelenghts. The signal you retrieve (and the classification is based on) represents physical characteristics of the surfaces (roughness and moisture, among others). Rice, water and built-up structures have different types of backscatter mechanisms, so they should be separable quite well. Build-up structures cause corner reflection (very high backscatter), water is mostly smooth and rice produces volume scattering once crops are developed. Especially if you are using images of different dates, its signature will change and be therefore quite unique.
The solution is already solved in here,
and in here,
If I understand your question well, Your input data are GRD, so the only information available is intensity.
thank you sir for your quick response
I will go through your steps
thank you so much.
By default the “number of training samples” is 5000 in any classifier in SNAP. How does it effect the results exactly and if I increase it’s value, will the accuracy improve ?
please have a look at my comments here: Number of training samples at Random forest classifier
This is related to the size of your study area, please also read here: Issue with Supervised random forest classification
hi team,
sorry for lack of knowledge,as per my concern while we are doing the classification by any technique, we need take vector samples, then only we can classify our products.
is there any technique to classify the products by giving the back-scatter ranges (like -14 db to -19 db & -24 db to -30 db ) only based on our requirement without giving any vector samples??
if any technique is there please help me to classify the products.
and one more question is after done the classification how can we see the statistics based on area wise.
please help me to do that process.
thank you in advance.
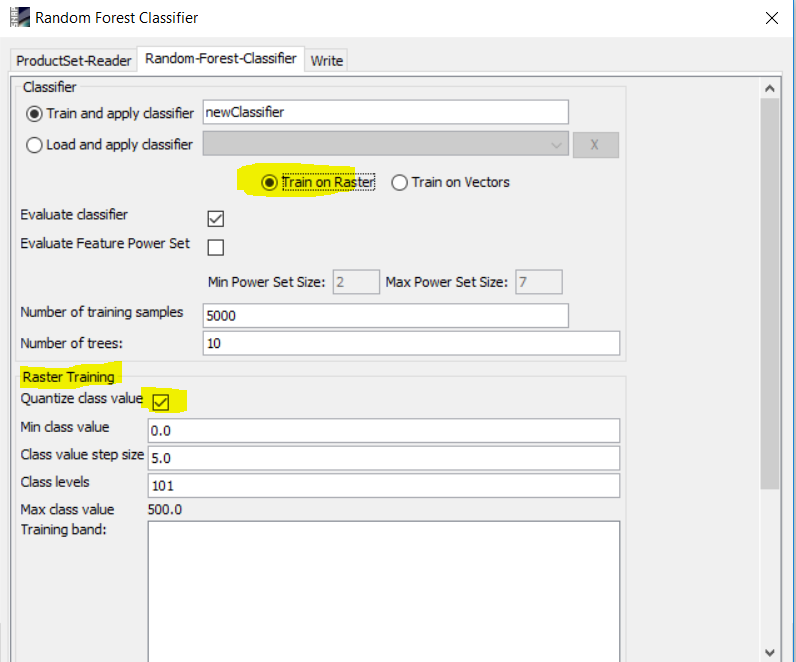
Did you try up train on raster and then identify your thresholds in Quantize class value ,
Did you check up this post
I don’t think it makes a large difference. But to be honest, I don’t know.