Question is that how to Mark a fault by InSAR Data in SNAP and what kind of Data have to download from scihub. number 2nd what is the difference between SLC_1SSV data and SLC_1SDV data.
There isn’t any good way of marking and labeling in SNAP. It would be good to add.
In the product naming, SV means single pol VV and DV means dual pol VV+VH
1 Like
i have generated the Orb_Stack but after that the interferometric phase is not displaying, in main window please find the attached snap shot of the displayed phase.
Thank you.

maybe the coregistration wasn’t successful. Did you check if both images are well aligned, for example by an RGB image?
Thank you for your kind reply @ABraun. maybe you are right, but i do not know how to check both images are well aligned, please right the process of checking. thanks
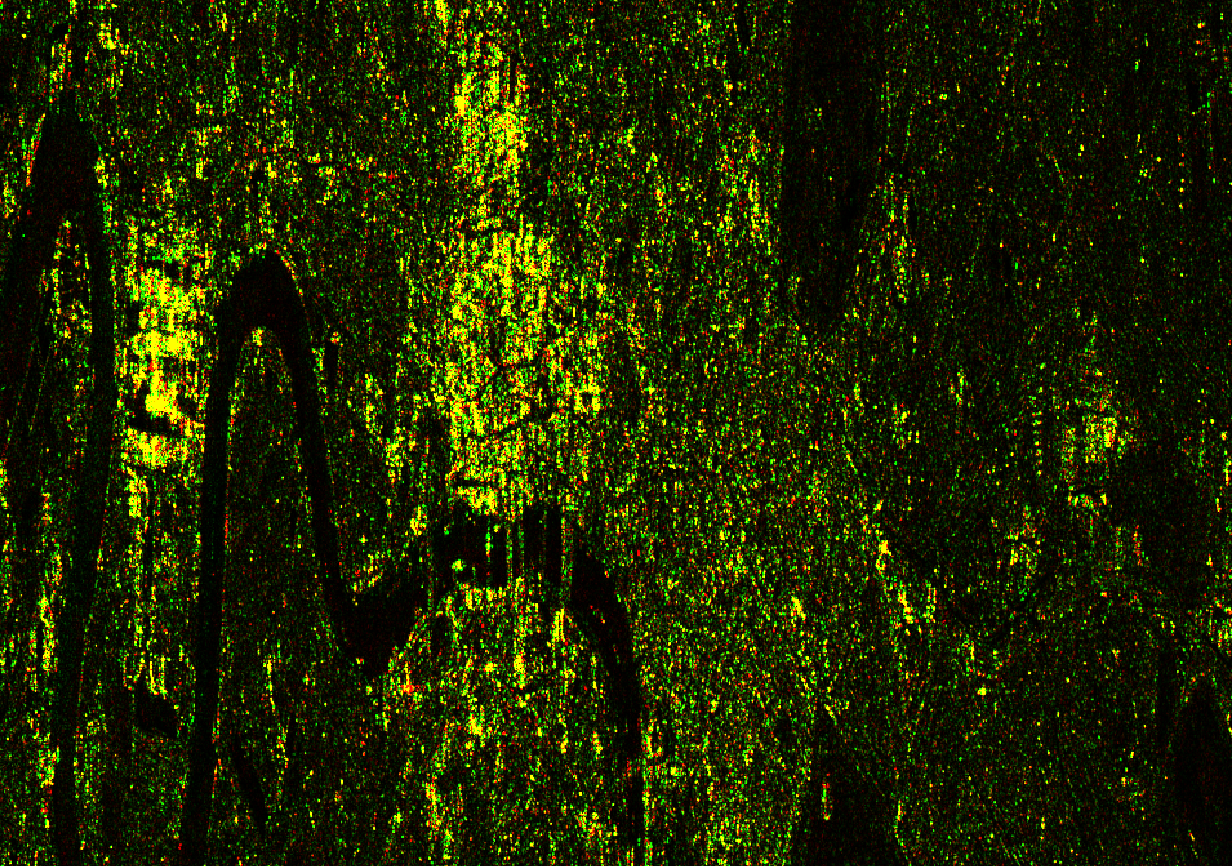
right-click on your stack and select “Open RGB image Window” Select the intensity of image 1 for red and image 2 for green.
It should then look something like this
3 Likes
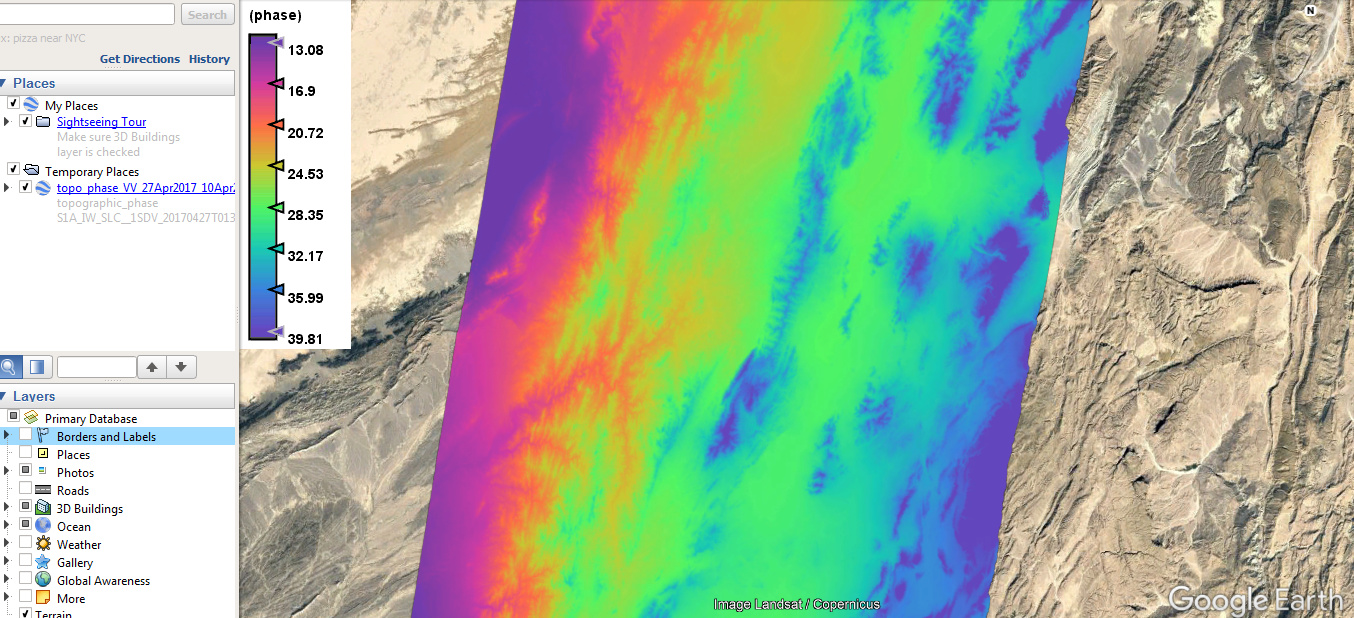
Hi, i am working on geo hazards using S1A data, kindly any one suggest me that how to measure the horizontal displacement or the movement of a fault. i did the terrain correction and now want to measure the Fault horizontal displacement. the result after terrain correction TOPO Phase, is mentioned in the picture. and want to know that in what the destruction has been measured in the mentioned picture cm Or mm? Thanks
before the terrain correction, you have to convert the unwrapped phase into displacement values as described here: Subsidence map in 3d view
Please note that theis only describes the displacement along the line of side (LOS), that is the slant direction between the SAR sensor and the earth’s surface. A similar question was asked here: Phase to Displacement Units?
the unwrap phase is not working or i am not doing well. Kindly provide me the tutorial from the start till end. i will be thankful to you. as i am working to measure displacement of a fault.
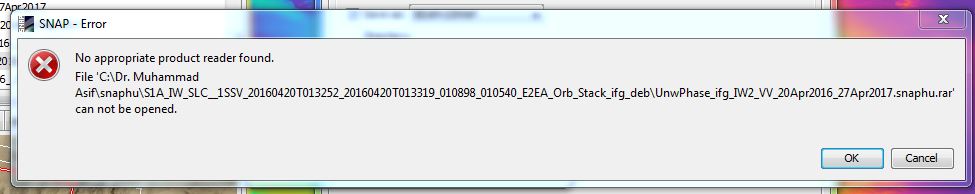
why does it end with .rar?
As for tutorials:
- Correct steps to form an interferogram: http://step.esa.int/docs/tutorials/S1TBX%20TOPSAR%20Interferometry%20with%20Sentinel-1%20Tutorial.pdf
For Differential Interferometry, make sure you include the topographic phase removal in the inteferogram generation step. - Unwrap the interferogram: https://media.asf.alaska.edu/uploads/pdf/current_data_recipe_pdfs/insar_phase_unwrapping_v5.pdf
- Convert to Displacement as described here: Subsidence map in 3d view
Hi Sir,
What does phase mean in the uploaded picture? are these number shows us the uplifted deformation in mm or the horizontal deformation?? can we use the phase as the annual deformation rate of the particular area?? as i used a set of data, one of these is 2017 and one is 2018. And what the negative phase indicate??
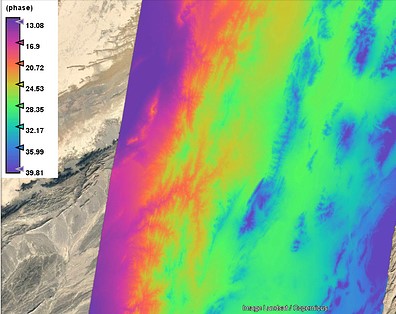
are you sure this is not the topographic phase?
i am 100 percent sure that is a topographic phase. i processed it as S1 TOPS Coregistration–Interferogram Formation–S1 TOPS Deburst–Topographic phase removal – Golstein Phase Filtering. Is this right processing??
Exactly, but topographic phase is not part of the data you are interested in, it is computed from a DEM to be removed from the actual phase.
how can i do that???
I explained it above: Fault marking by InSAR Data and difference between SLC_1SSV and SLC_1SDV?
Maybe this also helps: https://www.youtube.com/watch?v=xbIrhbzNrRo
TanDEM-X is commercial but there is the chance to apply for a quota of data:
https://tandemx-science.dlr.de/
Have a look at the guidelines of “General Proposal submission”
working on S1A_IW_SLC__1SDV data i processed as in the above tutorial from the start till end, now please tell me after completing that process where should i process the unwrap to make an unwrapped phase that i may measure the displacement. please write for me as coregistration __interferometric and so on…
- Export the data with Radar > Interferometric > Unwrapping > snaphu export
- Process the interferogram outside snap as described ehre: https://www.youtube.com/watch?v=sH4Uhsgmpak
- Import the image back in SNAP