StaMPS-Visualizer, SNAP-StaMPS Workflow

Dear @thho

Thank you so much for the answer and suggestions,

My area is really a small area and 10 km is very enough to include all points, and it has so many PS points inside like below

And when ı try it with 100 km radius, again it gives me the same error

Hello Dear @thho and @ABraun
Inside this code " export_res = [lon2 lat2 ver ts]" my ts file is 1x94(number of total interferograms),

I think it should be number of PS points (70128)x94, right ? when ı use ts option with any radius scale (from 100m to 10000 m) , my ts matrix dimensions again are 1x94,

I think, ı have a problem about my ts file, why it is like this and how can ı fix it ? (ı am using StaMPS_4.1b)

Thank you so much

1 Like

indeed, that could be an explanation. I currently do not have access to a matlab license, and can not run the new StaMPS to check for differences of the objects created during ts_plot… :\

Hello Dear @thho
The problem was about the ts file in staMPS_4.1-b which ı installed. ı think ı made a mistake about installing or ı have some bug ı don’t know. But ı try it with old version ‘‘staMPS_v3.3b1’’ again and it worked like below .

Thank you so much for the program again.

1 Like

Dear @firat, nice to see your result and the visualizer working! Try the newer version from github, OSM tiles are now available which could be very helpful for urban areas :slight_smile:

@ABraun
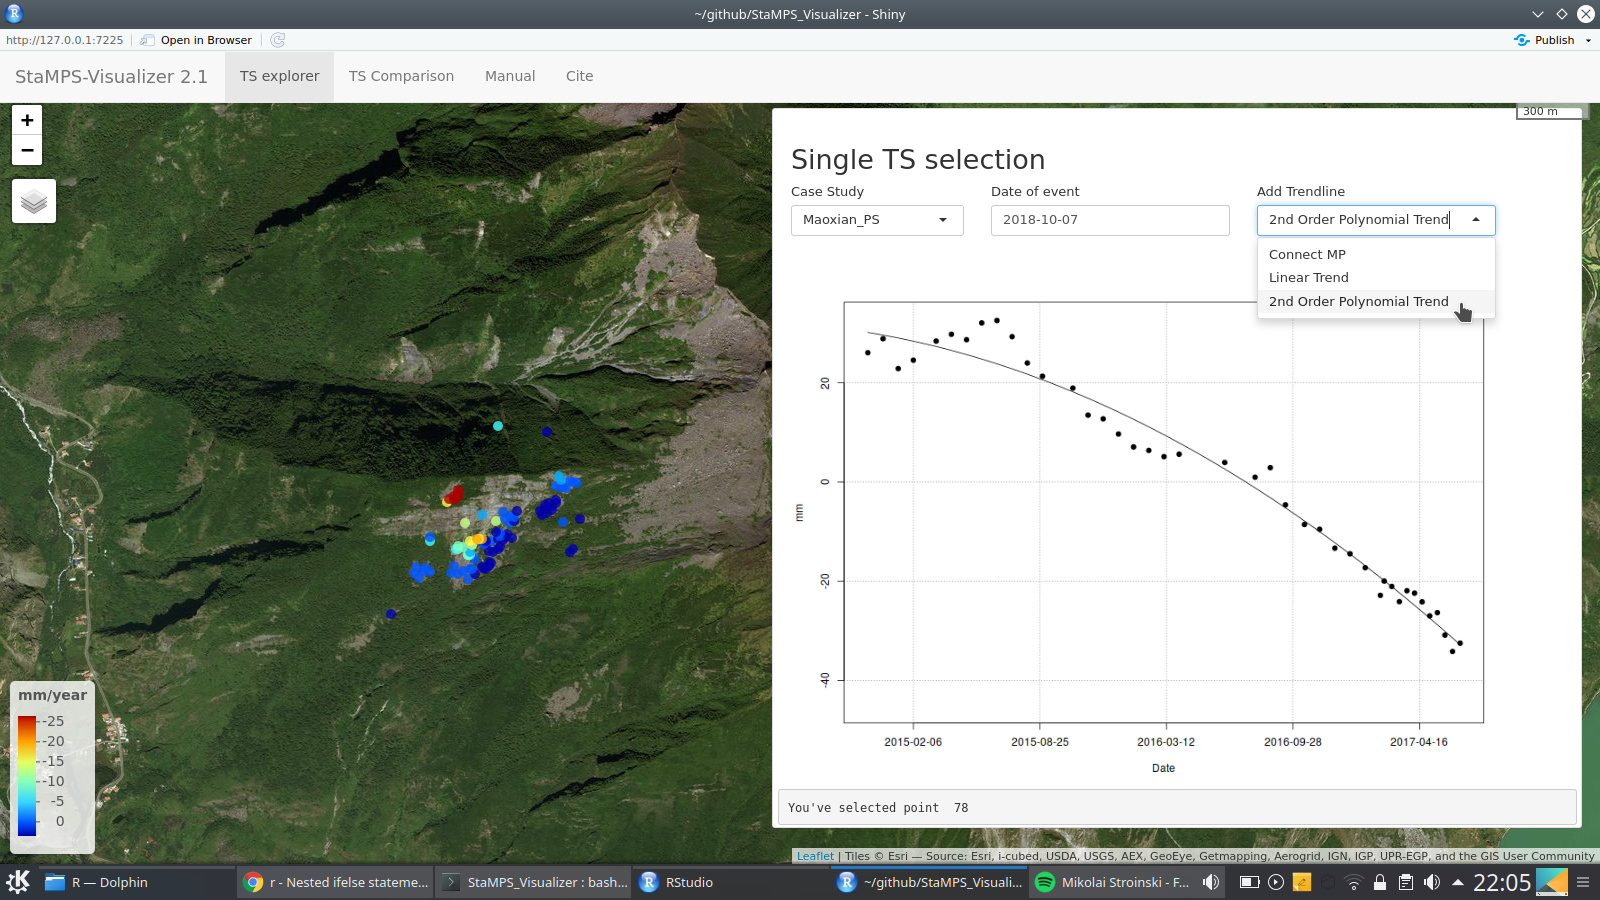
, linear and 2nd order polynomial trends are now available for StamPS-Visualizer

4 Likes

that is just great, thank you!

just tested the new version, perfect!

1 Like

Nice to see and hear you liked it @ABraun, the option to scale the point size is absolutely possible and I have already programmed a slidebarInput for this simple task…but there seems to be a problem or some kind of conflict with the embedding of the css file or the css file itself and the sliderInput…atm the position of the settings and plot panel influences the usability of the slider with it and I was not able to figure it out until now. I will look after it in my next round working on the app. Until then, you are welcome to use the time for more ideas which could be useful within the app.

Hi ABraun, can you tell me how do you export your PS data to be used by that Qgis Plugin?, I have already processed my data via SNAP-Stamps and now I would like to visualize it.

Thank you

It’s a bit tricky but it works.

Basically, you need to export it with the matlab-script demonstrated by ttho in his tool. This gives you a CSV table with coordinates and single values per date. I import this in excel and create an additional header with the date formatted as required by the plugin (D20181017). Once this is done, you can save it as a CSV and import it into QGIS with the “add delimited text” option.
To save RAM, save it as a Shapefile.

This file demonstrates how exactly the attribute table should be formatted to be used in the QGIS plugin: https://gitlab.com/faunalia/ps-speed/tree/master/testdata/shape

It is close to what is exported from Matlab but some adjustments have to be made.

4 Likes

Thank you ABraun, I was quite surprised when I saw that plugin in the repository but I had no idea how it worked and I couldn’t find the documentation, I will try it and see if I can add the extra column automatically, thanks for your help.

Hello @thho, if you want, ı can give you an idea which can be helpful for your program :slight_smile:

Adding point optiong for example ? for seing which levelling or GNSS point is close to which PS point.
This can be very helpful for users.

Also if we can add the vertical velocities or coordinates of our levelling or GNSS points, and then if we can compare our terrestirial results with image results like this, it can be so much better.

Dear @firat,

thank you for your suggestion, it is similar to the one you mentioned some weeks earlier and in fact I have started working on it but have to stop, due to the fact, that I have come to a point where I have to expand the whole project and give it more time. The GPS comparison will come sooner or later, atm I am no longer brave enough to make statements about a date, because I have to work on it in my spare time and next to other projects. Anyway, smaller features will be added gradually so feel free and thereby I would like to encourage everybody, to mention features you are missing, I will put them on the list :slight_smile:

2 Likes

hi,ABraun, I have export the kml inmy patch folder,but the kml is too large to load in google earth,what should i do?

actually, the script exports a csv file. Are you sure you entered the correct file extension?
A kml is only needed when you want to subset your data as described here: StaMPS-Visualizer, SNAP-StaMPS Workflow

i means when i finish the step “output to google earth”,the kml is too large

this is not related to the StaMPS-Visualizer then, but you find answers here:

oh , i want to use Stamps-visualizer, but dont know where to start with ,my plotform is windows can i finish the visualier under windows,can you give me some advice

Although I still believe that the whole StaMPS workflow only runs without errors under Linux, it should be possible to use the Visualizer in Windows to display the results. But note that first you will have to produce correct displacements with StaMPS (until step 7 at least)

You need to export the results from Matlab first, the visualizer itself can then be used to display the results. Please start with the list in the first post and install R and RStudio to run the scripts provided there. Once the Visualizer runs, you can find a detailled description on how to export the data as CSV from Matlab to be analyzed in this software.

1 Like